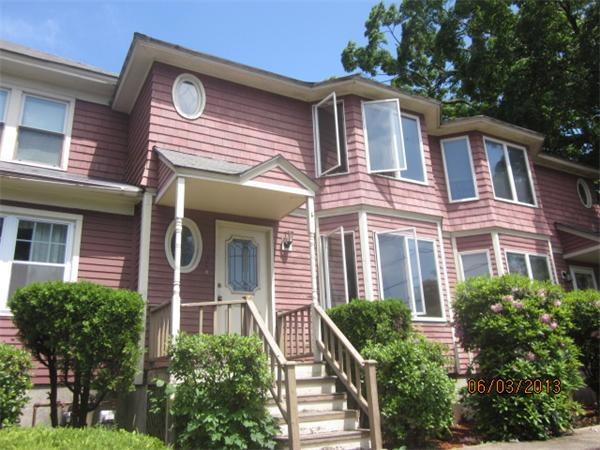
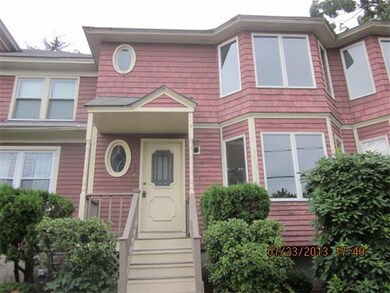
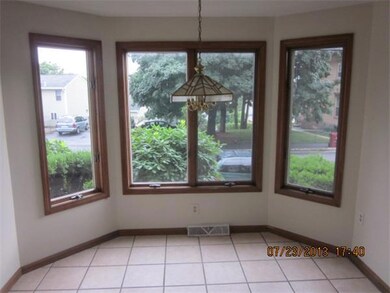
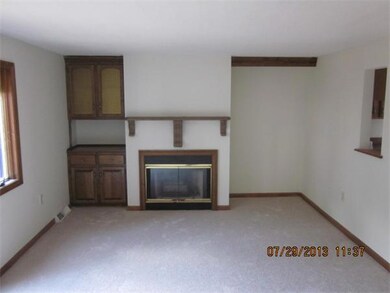
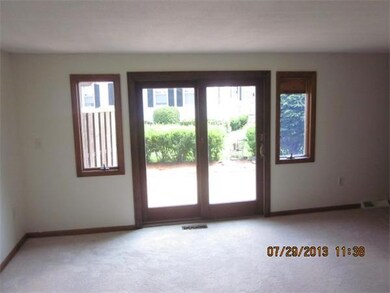
116 Nesmith St Unit 3 Lowell, MA 01852
Belvidere NeighborhoodAbout This Home
As of July 2019Why rent when you can buy!Two Bedrooms, 1.5 baths townhouse style in small 4 units complex. Easy access to all major routes. This is a Fannie Mae Homepath Property. You can purchase this property for as little as 5% down. It is approved for HomePath Mortgage financing and HomePath Renovation mortgage.
Last Buyer's Agent
Robin Frank
ERA Key Realty Services - Distinctive Group

Ownership History
Purchase Details
Home Financials for this Owner
Home Financials are based on the most recent Mortgage that was taken out on this home.Purchase Details
Home Financials for this Owner
Home Financials are based on the most recent Mortgage that was taken out on this home.Purchase Details
Purchase Details
Home Financials for this Owner
Home Financials are based on the most recent Mortgage that was taken out on this home.Purchase Details
Purchase Details
Map
Property Details
Home Type
Condominium
Est. Annual Taxes
$3,855
Year Built
1955
Lot Details
0
Listing Details
- Unit Level: 1
- Unit Placement: Upper
- Special Features: 20
- Property Sub Type: Condos
- Year Built: 1955
Interior Features
- Has Basement: No
- Fireplaces: 1
- Number of Rooms: 4
- Amenities: Shopping
Exterior Features
- Construction: Frame
- Exterior: Wood
- Exterior Unit Features: Deck
Garage/Parking
- Parking: Off-Street
- Parking Spaces: 1
Condo/Co-op/Association
- Management: Professional - Off Site
- Pets Allowed: Yes w/ Restrictions
- No Units: 4
- Optional Fee: 150.00
- Unit Building: 3
Home Values in the Area
Average Home Value in this Area
Purchase History
| Date | Type | Sale Price | Title Company |
|---|---|---|---|
| Not Resolvable | $245,000 | -- | |
| Not Resolvable | $207,000 | -- | |
| Quit Claim Deed | -- | -- | |
| Not Resolvable | $130,000 | -- | |
| Foreclosure Deed | $259,025 | -- | |
| Deed | $86,000 | -- |
Mortgage History
| Date | Status | Loan Amount | Loan Type |
|---|---|---|---|
| Open | $220,500 | Stand Alone Refi Refinance Of Original Loan | |
| Closed | $220,500 | New Conventional | |
| Previous Owner | $196,650 | New Conventional | |
| Previous Owner | $123,500 | New Conventional | |
| Previous Owner | $25,908 | No Value Available | |
| Previous Owner | $190,000 | No Value Available | |
| Previous Owner | $58,000 | No Value Available | |
| Previous Owner | $20,000 | No Value Available |
Property History
| Date | Event | Price | Change | Sq Ft Price |
|---|---|---|---|---|
| 07/12/2019 07/12/19 | Sold | $245,000 | +14.0% | $229 / Sq Ft |
| 05/21/2019 05/21/19 | Pending | -- | -- | -- |
| 05/15/2019 05/15/19 | For Sale | $215,000 | +3.9% | $201 / Sq Ft |
| 07/08/2016 07/08/16 | Sold | $207,000 | +3.6% | $138 / Sq Ft |
| 06/05/2016 06/05/16 | Pending | -- | -- | -- |
| 06/01/2016 06/01/16 | For Sale | $199,900 | +53.8% | $134 / Sq Ft |
| 04/17/2014 04/17/14 | Sold | $130,000 | 0.0% | $122 / Sq Ft |
| 02/20/2014 02/20/14 | Pending | -- | -- | -- |
| 02/14/2014 02/14/14 | Off Market | $130,000 | -- | -- |
| 02/06/2014 02/06/14 | Price Changed | $124,900 | -3.9% | $117 / Sq Ft |
| 02/04/2014 02/04/14 | For Sale | $130,000 | 0.0% | $122 / Sq Ft |
| 01/15/2014 01/15/14 | Pending | -- | -- | -- |
| 12/18/2013 12/18/13 | Price Changed | $130,000 | -9.7% | $122 / Sq Ft |
| 12/11/2013 12/11/13 | For Sale | $144,000 | 0.0% | $135 / Sq Ft |
| 11/21/2013 11/21/13 | Pending | -- | -- | -- |
| 11/20/2013 11/20/13 | Price Changed | $144,000 | -9.9% | $135 / Sq Ft |
| 10/23/2013 10/23/13 | Price Changed | $159,900 | -5.9% | $150 / Sq Ft |
| 09/23/2013 09/23/13 | Price Changed | $169,900 | -5.6% | $159 / Sq Ft |
| 08/26/2013 08/26/13 | Price Changed | $179,900 | -13.1% | $168 / Sq Ft |
| 07/23/2013 07/23/13 | For Sale | $207,000 | -- | $194 / Sq Ft |
Tax History
| Year | Tax Paid | Tax Assessment Tax Assessment Total Assessment is a certain percentage of the fair market value that is determined by local assessors to be the total taxable value of land and additions on the property. | Land | Improvement |
|---|---|---|---|---|
| 2025 | $3,855 | $335,800 | $0 | $335,800 |
| 2024 | $3,634 | $305,100 | $0 | $305,100 |
| 2023 | $3,347 | $269,500 | $0 | $269,500 |
| 2022 | $3,180 | $250,600 | $0 | $250,600 |
| 2021 | $3,004 | $223,200 | $0 | $223,200 |
| 2020 | $2,888 | $216,200 | $0 | $216,200 |
| 2019 | $2,821 | $200,900 | $0 | $200,900 |
| 2018 | $2,628 | $184,400 | $0 | $184,400 |
| 2017 | $2,593 | $173,800 | $0 | $173,800 |
| 2016 | $2,462 | $162,400 | $0 | $162,400 |
| 2015 | $2,368 | $153,000 | $0 | $153,000 |
| 2013 | $2,127 | $141,700 | $0 | $141,700 |
Source: MLS Property Information Network (MLS PIN)
MLS Number: 71559479
APN: LOWE-000200-004280-000116-000003
Disclaimer: Certain information contained herein is derived from information provided by parties other than Homes.com. All information provided is deemed reliable, but is not guaranteed to be accurate and should be independently verified.
![]() The property listing data and information, or the Images, set forth herein were provided to MLS Property Information Network, Inc. from third party sources, including sellers, lessors and public records, and were compiled by MLS Property Information Network, Inc. The property listing data and information, and the Images, are for the personal, non-commercial use of consumers having a good faith interest in purchasing or leasing listed properties of the type displayed to them and may not be used for any purpose other than to identify prospective properties which such consumers may have a good faith interest in purchasing or leasing. MLS Property Information Network, Inc. and its subscribers disclaim any and all representations and warranties as to the accuracy of the property listing data and information, or as to the accuracy of any of the Images, set forth herein.
The property listing data and information, or the Images, set forth herein were provided to MLS Property Information Network, Inc. from third party sources, including sellers, lessors and public records, and were compiled by MLS Property Information Network, Inc. The property listing data and information, and the Images, are for the personal, non-commercial use of consumers having a good faith interest in purchasing or leasing listed properties of the type displayed to them and may not be used for any purpose other than to identify prospective properties which such consumers may have a good faith interest in purchasing or leasing. MLS Property Information Network, Inc. and its subscribers disclaim any and all representations and warranties as to the accuracy of the property listing data and information, or as to the accuracy of any of the Images, set forth herein.
- Lot 2B Wyman Clithoroe St
- Lot 2A Clitheroe Wyman
- 15 Harrison St
- 30 Mansur St
- 53 Pond St
- 234 Nesmith St Unit 15
- 220 Concord St
- 105 Chestnut St
- 80 Rogers St Unit 504
- 32 Belmont Ave
- 355 Andover St
- 499 High St Unit 499
- 317 Nesmith St
- 39 Groves Ave
- 15 Alton St Unit 16
- 24 Abbott St
- 30 Wentworth Ave
- 346 Rogers St
- 333 First Street Blvd Unit 310
- 36 Chapel St