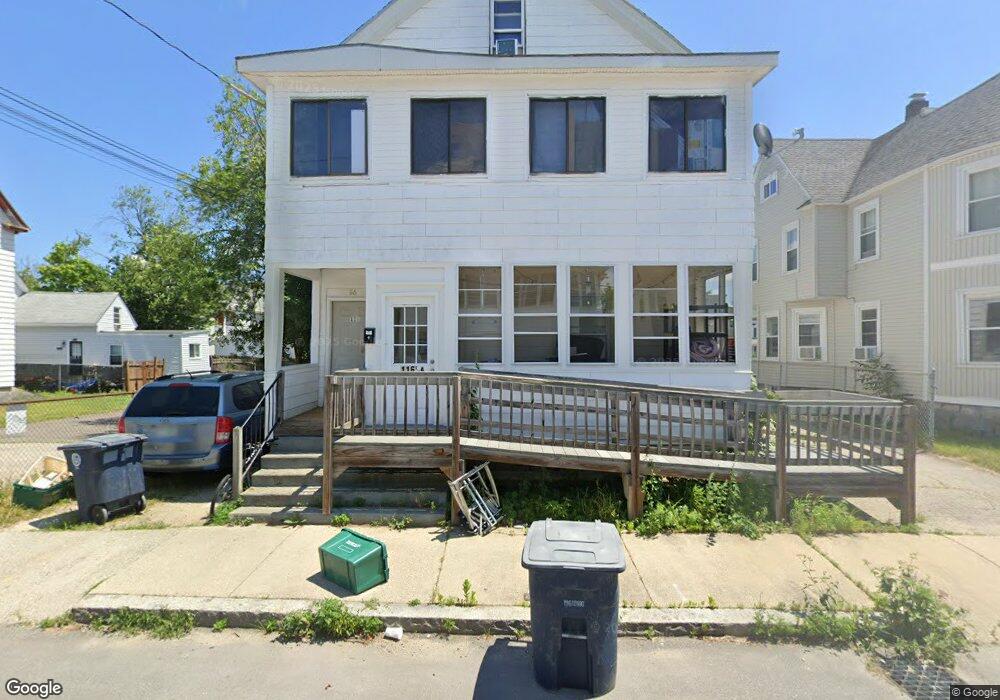
116 Palm St Nashua, NH 03060
South End Nashua NeighborhoodEstimated Value: $608,000 - $802,000
7
Beds
3
Baths
3,574
Sq Ft
$197/Sq Ft
Est. Value
About This Home
This home is located at 116 Palm St, Nashua, NH 03060 and is currently estimated at $704,622, approximately $197 per square foot. 116 Palm St is a home located in Hillsborough County with nearby schools including Fairgrounds Elementary School, Elm Street Middle School, and Nashua High School South.
Ownership History
Date
Name
Owned For
Owner Type
Purchase Details
Closed on
Sep 29, 2023
Sold by
Surprenant Ft and Surprenant
Bought by
Galvez Yaneira and Galvez Ernesto
Current Estimated Value
Home Financials for this Owner
Home Financials are based on the most recent Mortgage that was taken out on this home.
Original Mortgage
$487,500
Outstanding Balance
$477,410
Interest Rate
7.09%
Mortgage Type
Purchase Money Mortgage
Estimated Equity
$227,212
Purchase Details
Closed on
Oct 13, 2020
Sold by
Surprenent Arthur R
Bought by
Surprenant Ft and Surprenant
Create a Home Valuation Report for This Property
The Home Valuation Report is an in-depth analysis detailing your home's value as well as a comparison with similar homes in the area
Home Values in the Area
Average Home Value in this Area
Purchase History
| Date | Buyer | Sale Price | Title Company |
|---|---|---|---|
| Galvez Yaneira | $650,000 | None Available | |
| Surprenant Ft | -- | None Available |
Source: Public Records
Mortgage History
| Date | Status | Borrower | Loan Amount |
|---|---|---|---|
| Open | Galvez Yaneira | $487,500 |
Source: Public Records
Tax History Compared to Growth
Tax History
| Year | Tax Paid | Tax Assessment Tax Assessment Total Assessment is a certain percentage of the fair market value that is determined by local assessors to be the total taxable value of land and additions on the property. | Land | Improvement |
|---|---|---|---|---|
| 2024 | $8,279 | $520,700 | $120,200 | $400,500 |
| 2023 | $7,733 | $424,200 | $96,200 | $328,000 |
| 2022 | $7,665 | $424,200 | $96,200 | $328,000 |
| 2021 | $6,369 | $274,300 | $64,100 | $210,200 |
| 2020 | $6,211 | $274,700 | $64,100 | $210,600 |
| 2019 | $5,977 | $274,700 | $64,100 | $210,600 |
| 2018 | $5,826 | $274,700 | $64,100 | $210,600 |
| 2017 | $4,521 | $175,300 | $63,400 | $111,900 |
| 2016 | $4,395 | $175,300 | $63,400 | $111,900 |
| 2015 | $4,300 | $175,300 | $63,400 | $111,900 |
| 2014 | $4,216 | $175,300 | $63,400 | $111,900 |
Source: Public Records
Map
Nearby Homes
- 8 Buck St Unit 10
- 22 Wilder St
- 15 Lovell St Unit 3
- 15 Lovell St Unit 7
- 15 Lovell St Unit 10
- 4 Badger St
- 5 Mulberry St
- 30 Ledge St
- 24 E Otterson St
- 38 Central St
- 169A W Hollis St Unit 193
- 97 Linwood St
- 2 Lyons St
- 1 Circle Ave
- 63 Dexter St
- 18 Harbor Ave Unit 208
- 65 Allds St
- 27 Fifield St Unit 13
- 13 Mulvanity St
- 11 Charles St