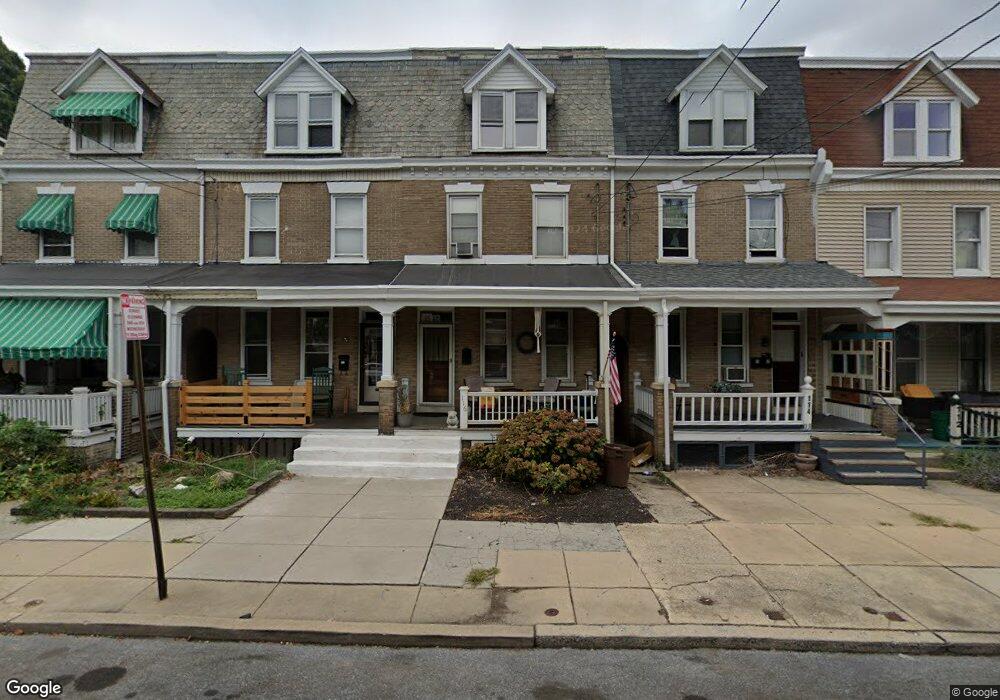
116 Pearl St Lancaster, PA 17603
West End NeighborhoodEstimated Value: $217,000 - $309,000
4
Beds
2
Baths
1,792
Sq Ft
$152/Sq Ft
Est. Value
About This Home
This home is located at 116 Pearl St, Lancaster, PA 17603 and is currently estimated at $272,968, approximately $152 per square foot. 116 Pearl St is a home located in Lancaster County with nearby schools including Smith-Wade-El Elementary School, Wheatland Middle School, and McCaskey High School.
Ownership History
Date
Name
Owned For
Owner Type
Purchase Details
Closed on
Jul 17, 2009
Sold by
Witmer Timothy and Bradish Ryan
Bought by
Bradish Stephen R and Bradish Janet Marie
Current Estimated Value
Purchase Details
Closed on
Nov 1, 2006
Sold by
Barto Melissa and Bender Melissa
Bought by
Deutsche Bank National Trust Co and Morgan Stanley Abs Capital I Inc Trust 2
Purchase Details
Closed on
Jun 28, 2002
Sold by
Washington Mutual Bank Fa
Bought by
Harmel Enterprises Inc
Purchase Details
Closed on
Feb 27, 2002
Sold by
Morales Freddy and Morales Bernice
Bought by
Pnc Bank Na
Create a Home Valuation Report for This Property
The Home Valuation Report is an in-depth analysis detailing your home's value as well as a comparison with similar homes in the area
Home Values in the Area
Average Home Value in this Area
Purchase History
| Date | Buyer | Sale Price | Title Company |
|---|---|---|---|
| Bradish Stephen R | $90,000 | None Available | |
| Deutsche Bank National Trust Co | $3,436 | None Available | |
| Harmel Enterprises Inc | $47,000 | First American Title Ins Co | |
| Pnc Bank Na | $2,382 | -- |
Source: Public Records
Tax History Compared to Growth
Tax History
| Year | Tax Paid | Tax Assessment Tax Assessment Total Assessment is a certain percentage of the fair market value that is determined by local assessors to be the total taxable value of land and additions on the property. | Land | Improvement |
|---|---|---|---|---|
| 2025 | $4,016 | $101,500 | $23,800 | $77,700 |
| 2024 | $4,016 | $101,500 | $23,800 | $77,700 |
| 2023 | $3,949 | $101,500 | $23,800 | $77,700 |
| 2022 | $3,784 | $101,500 | $23,800 | $77,700 |
| 2021 | $3,703 | $101,500 | $23,800 | $77,700 |
| 2020 | $3,703 | $101,500 | $23,800 | $77,700 |
| 2019 | $3,648 | $101,500 | $23,800 | $77,700 |
| 2018 | $2,165 | $101,500 | $23,800 | $77,700 |
| 2017 | $3,969 | $86,400 | $23,200 | $63,200 |
| 2016 | $3,932 | $86,400 | $23,200 | $63,200 |
| 2015 | $1,534 | $86,400 | $23,200 | $63,200 |
| 2014 | $3,432 | $86,400 | $23,200 | $63,200 |
Source: Public Records
Map
Nearby Homes