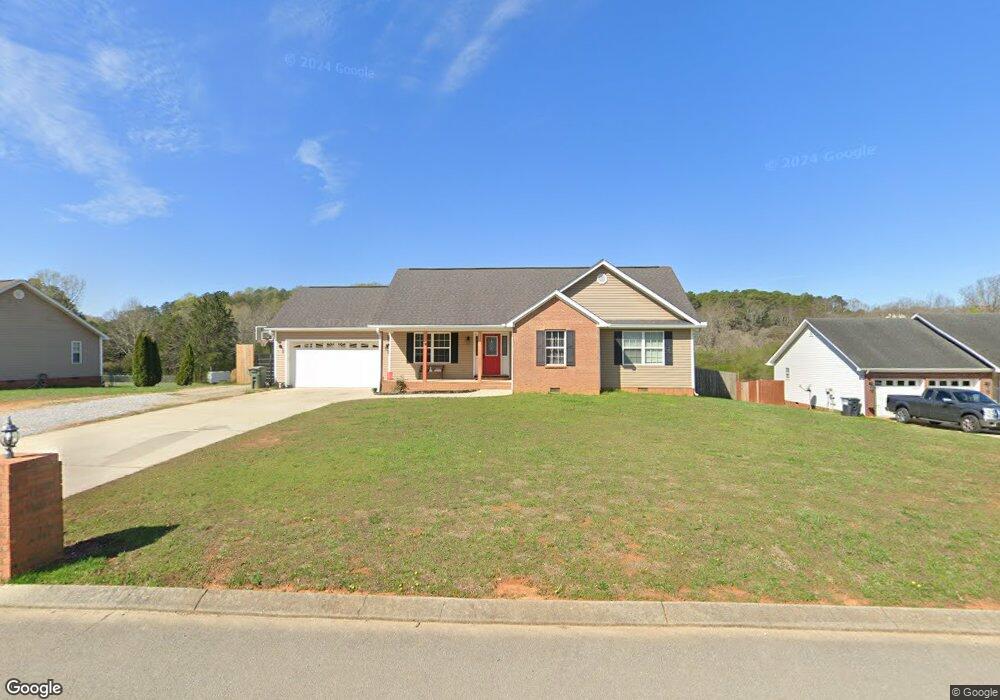
116 Pebblestone Dr La Fayette, GA 30728
Noble NeighborhoodEstimated Value: $268,090 - $290,000
3
Beds
2
Baths
1,315
Sq Ft
$210/Sq Ft
Est. Value
About This Home
This home is located at 116 Pebblestone Dr, La Fayette, GA 30728 and is currently estimated at $275,773, approximately $209 per square foot. 116 Pebblestone Dr is a home located in Walker County with nearby schools including Rock Spring Elementary School and Lafayette High School.
Ownership History
Date
Name
Owned For
Owner Type
Purchase Details
Closed on
Jul 14, 2021
Sold by
Quillen Justin J
Bought by
Holder Jerry David and Holder Mandy Ellen
Current Estimated Value
Home Financials for this Owner
Home Financials are based on the most recent Mortgage that was taken out on this home.
Original Mortgage
$198,947
Outstanding Balance
$180,596
Interest Rate
2.93%
Mortgage Type
New Conventional
Estimated Equity
$95,177
Purchase Details
Closed on
Jan 20, 2009
Sold by
Quillen Gloria M
Bought by
Quillen Justin J
Purchase Details
Closed on
Feb 23, 2006
Sold by
Not Provided
Bought by
Quillen Justin J
Purchase Details
Closed on
Jan 25, 2005
Sold by
Not Provided
Bought by
Wilhoite John and Wilhoite Linda
Home Financials for this Owner
Home Financials are based on the most recent Mortgage that was taken out on this home.
Original Mortgage
$110,000
Interest Rate
5.72%
Mortgage Type
New Conventional
Purchase Details
Closed on
Nov 6, 2003
Sold by
Hunt-Maples Llc
Bought by
Chase James
Purchase Details
Closed on
Aug 1, 2002
Bought by
Hunt-Maples Llc
Create a Home Valuation Report for This Property
The Home Valuation Report is an in-depth analysis detailing your home's value as well as a comparison with similar homes in the area
Home Values in the Area
Average Home Value in this Area
Purchase History
| Date | Buyer | Sale Price | Title Company |
|---|---|---|---|
| Holder Jerry David | $205,100 | -- | |
| Quillen Justin J | -- | -- | |
| Quillen Justin J | $135,000 | -- | |
| Wilhoite John | $26,500 | -- | |
| Chase James | $22,000 | -- | |
| Hunt-Maples Llc | $155,000 | -- |
Source: Public Records
Mortgage History
| Date | Status | Borrower | Loan Amount |
|---|---|---|---|
| Open | Holder Jerry David | $198,947 | |
| Previous Owner | Wilhoite John | $110,000 |
Source: Public Records
Tax History Compared to Growth
Tax History
| Year | Tax Paid | Tax Assessment Tax Assessment Total Assessment is a certain percentage of the fair market value that is determined by local assessors to be the total taxable value of land and additions on the property. | Land | Improvement |
|---|---|---|---|---|
| 2024 | $2,294 | $103,948 | $8,800 | $95,148 |
| 2023 | $2,236 | $99,088 | $8,800 | $90,288 |
| 2022 | $2,037 | $86,812 | $8,800 | $78,012 |
| 2021 | $1,695 | $62,800 | $8,800 | $54,000 |
| 2020 | $1,447 | $51,322 | $8,800 | $42,522 |
| 2019 | $1,473 | $51,322 | $8,800 | $42,522 |
| 2018 | $1,358 | $51,322 | $8,800 | $42,522 |
| 2017 | $1,615 | $51,322 | $8,800 | $42,522 |
| 2016 | $1,337 | $51,322 | $8,800 | $42,522 |
| 2015 | $1,434 | $52,076 | $8,800 | $43,276 |
| 2014 | $1,328 | $52,076 | $8,800 | $43,276 |
| 2013 | -- | $52,075 | $8,800 | $43,275 |
Source: Public Records
Map
Nearby Homes
- 0 Veeler Rd Unit 1522679
- 0 Veeler Rd Unit 10628696
- 11 Willow Cir
- The Pearson Plan at Laurel Ridge
- The Benson II Plan at Laurel Ridge
- The Langford Plan at Laurel Ridge
- The Lawson Plan at Laurel Ridge
- The Coleman Plan at Laurel Ridge
- The McGinnis Plan at Laurel Ridge
- The Caldwell Plan at Laurel Ridge
- 16 Willow Cir
- 329 Lynn Trail
- 23 Willow Cir
- 15 Willow Cir
- 3688 Straight Gut Rd
- 4654 Us Highway 27
- 10180 Us Highway 27
- 4582 Highway N 27
- 4544 N Highway 27
- 701 Bicentennial Trail
- 166 Pebblestone Dr
- 138 Pebblestone Dr
- 96 Pebblestone Dr
- 113 Pebblestone Dr
- 123 Pebblestone Dr
- 78 Pebblestone Dr
- 172 Pebblestone Dr
- 147 Pebblestone Dr Unit 99999
- 147 Pebblestone Dr
- 75 Pebblestone Dr
- 186 Pebblestone Dr
- 48 Pebblestone Dr
- 48 Pebblestone Dr Unit LOT 3
- 11 Flatstone Dr
- 59 Pebblestone Dr
- 26 Pebblestone Dr
- 35 Pebblestone Dr
- 0 Flatstone Dr Unit 8507646
- 0 Flatstone Dr Unit 8313231
- 51 Flatstone Dr