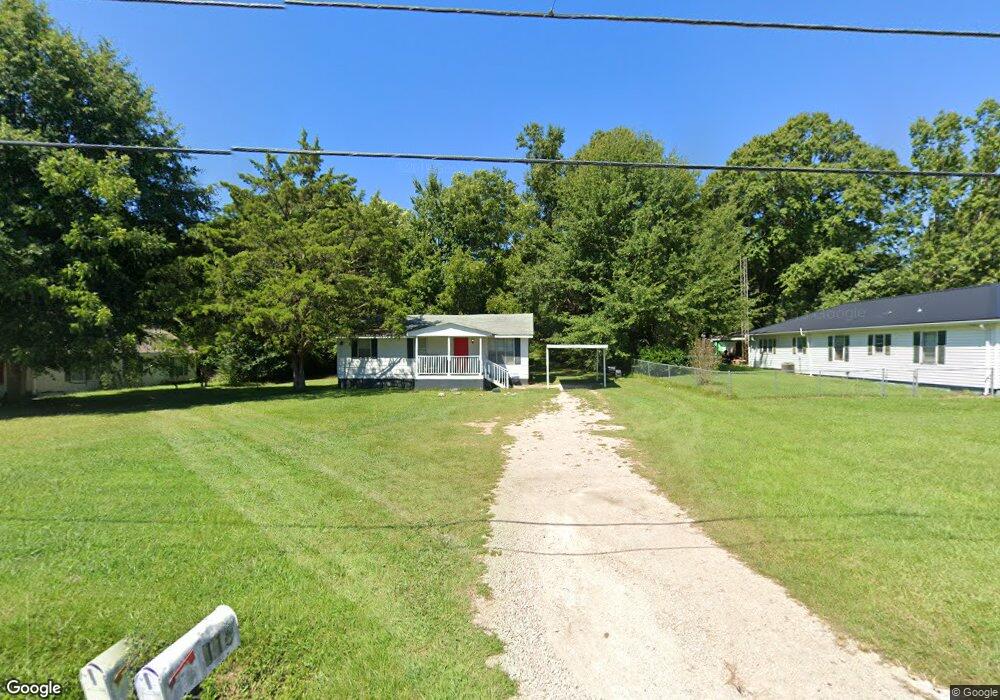
116 Pine Cir Lagrange, GA 30241
Estimated Value: $132,000 - $144,588
2
Beds
1
Bath
912
Sq Ft
$152/Sq Ft
Est. Value
About This Home
This home is located at 116 Pine Cir, Lagrange, GA 30241 and is currently estimated at $138,897, approximately $152 per square foot. 116 Pine Cir is a home located in Troup County with nearby schools including Hollis Hand Elementary School, Franklin Forest Elementary School, and Ethel W. Kight Elementary School.
Ownership History
Date
Name
Owned For
Owner Type
Purchase Details
Closed on
Nov 7, 2024
Sold by
Lagrange City
Bought by
Allen Michael
Current Estimated Value
Purchase Details
Closed on
Apr 8, 2022
Sold by
Frailey Robin S
Bought by
Allen Michael Joe
Home Financials for this Owner
Home Financials are based on the most recent Mortgage that was taken out on this home.
Original Mortgage
$96,224
Interest Rate
3.89%
Mortgage Type
FHA
Purchase Details
Closed on
Nov 19, 2009
Sold by
Turner Pamela S
Bought by
Frailey Robin S
Home Financials for this Owner
Home Financials are based on the most recent Mortgage that was taken out on this home.
Original Mortgage
$61,600
Interest Rate
4.98%
Mortgage Type
New Conventional
Purchase Details
Closed on
Sep 1, 1966
Sold by
Feagin Johnny
Bought by
Turner Donald L
Create a Home Valuation Report for This Property
The Home Valuation Report is an in-depth analysis detailing your home's value as well as a comparison with similar homes in the area
Purchase History
| Date | Buyer | Sale Price | Title Company |
|---|---|---|---|
| Allen Michael | -- | -- | |
| Allen Michael Joe | $98,000 | -- | |
| Frailey Robin S | $61,600 | -- | |
| Frailey Robin S | $61,600 | -- | |
| Turner Donald L | $2,200 | -- |
Source: Public Records
Mortgage History
| Date | Status | Borrower | Loan Amount |
|---|---|---|---|
| Previous Owner | Allen Michael Joe | $96,224 | |
| Previous Owner | Frailey Robin S | $61,600 |
Source: Public Records
Tax History
| Year | Tax Paid | Tax Assessment Tax Assessment Total Assessment is a certain percentage of the fair market value that is determined by local assessors to be the total taxable value of land and additions on the property. | Land | Improvement |
|---|---|---|---|---|
| 2025 | $1,212 | $44,432 | $10,000 | $34,432 |
| 2024 | $1,026 | $37,604 | $10,000 | $27,604 |
| 2023 | $1,069 | $39,412 | $10,000 | $29,412 |
| 2022 | $715 | $25,612 | $8,000 | $17,612 |
| 2021 | $479 | $15,868 | $2,480 | $13,388 |
| 2020 | $479 | $15,868 | $2,480 | $13,388 |
| 2019 | $451 | $14,948 | $2,480 | $12,468 |
| 2018 | $451 | $14,948 | $2,480 | $12,468 |
| 2017 | $451 | $14,948 | $2,480 | $12,468 |
| 2016 | $413 | $13,710 | $2,380 | $11,330 |
| 2015 | $414 | $13,710 | $2,380 | $11,330 |
| 2014 | $397 | $13,114 | $2,380 | $10,734 |
| 2013 | -- | $17,582 | $2,380 | $15,202 |
Source: Public Records
Map
Nearby Homes
- 113 Pine Cir
- 129 Mallory Dr
- 100 Dove Creek Ct
- 507 Headwater Ct Unit 6
- 503 Headwater Ct Unit 4D
- 302 Glenhaven Dr Unit 2D
- 502 Headwater Ct Unit 8D
- 311 Mourning Ct Unit LOT 33
- 200 River Meadow Dr
- 109 Shenandoah Ln
- 106 Shenandoah Ln Unit 26E
- 106 Shenandoah Ln
- 117 Shenandoah Ln Unit 22D
- 15 Fulton St
- 114 Shenandoah Ln
- 249 River Meadow Dr
- 240 River Meadow Dr
- 242 River Meadow Dr
- 2 Louise St
- 206 Freshwater Ct Unit 34E
Your Personal Tour Guide
Ask me questions while you tour the home.