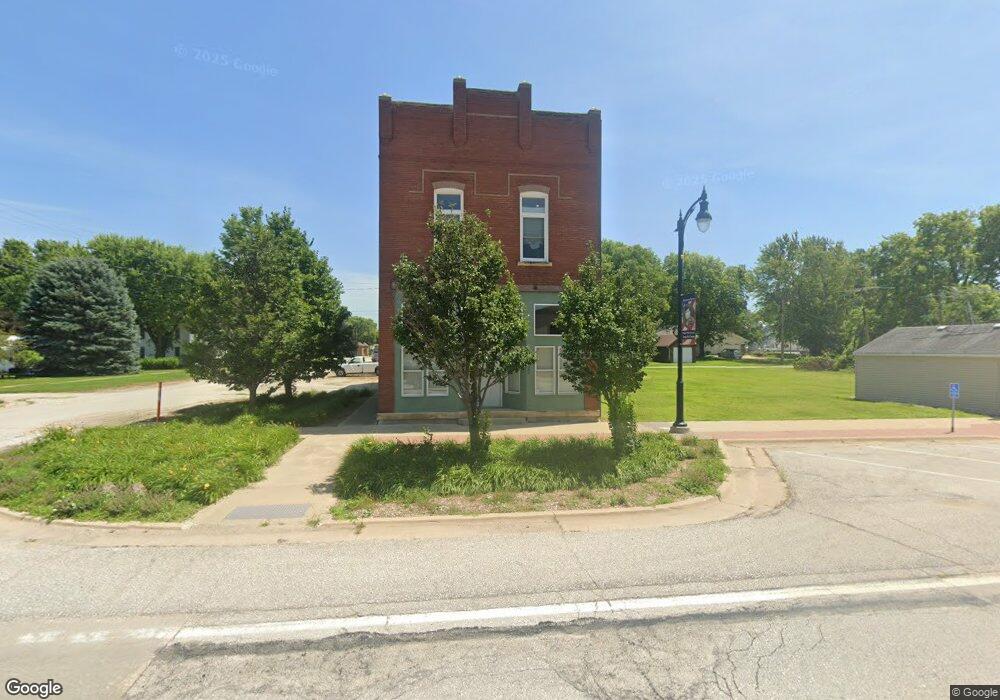
116 Pines St Auburn, IA 51433
Estimated Value: $115,000 - $144,268
--
Bed
--
Bath
3,500
Sq Ft
$37/Sq Ft
Est. Value
About This Home
This home is located at 116 Pines St, Auburn, IA 51433 and is currently estimated at $129,634, approximately $37 per square foot. 116 Pines St is a home with nearby schools including East Sac County High School.
Ownership History
Date
Name
Owned For
Owner Type
Purchase Details
Closed on
Jul 29, 2021
Sold by
Ortner Andrew J and Ortner Abby A
Bought by
Ross Property Investments Llc
Current Estimated Value
Home Financials for this Owner
Home Financials are based on the most recent Mortgage that was taken out on this home.
Original Mortgage
$50,000
Outstanding Balance
$8,850
Interest Rate
2.93%
Mortgage Type
New Conventional
Estimated Equity
$120,784
Purchase Details
Closed on
Jun 18, 2021
Sold by
Pudenz Roger C
Bought by
Ortner Andrew
Home Financials for this Owner
Home Financials are based on the most recent Mortgage that was taken out on this home.
Original Mortgage
$50,000
Outstanding Balance
$8,850
Interest Rate
2.93%
Mortgage Type
New Conventional
Estimated Equity
$120,784
Purchase Details
Closed on
Mar 11, 2010
Sold by
Pudenz Roger C
Bought by
Ortner Andrew
Create a Home Valuation Report for This Property
The Home Valuation Report is an in-depth analysis detailing your home's value as well as a comparison with similar homes in the area
Home Values in the Area
Average Home Value in this Area
Purchase History
| Date | Buyer | Sale Price | Title Company |
|---|---|---|---|
| Ross Property Investments Llc | $84,500 | None Listed On Document | |
| Ortner Andrew | -- | None Listed On Document | |
| Ortner Andrew | $11,000 | None Available |
Source: Public Records
Mortgage History
| Date | Status | Borrower | Loan Amount |
|---|---|---|---|
| Open | Ross Property Investments Llc | $50,000 | |
| Open | Ortner Andrew | $165,400 |
Source: Public Records
Tax History Compared to Growth
Tax History
| Year | Tax Paid | Tax Assessment Tax Assessment Total Assessment is a certain percentage of the fair market value that is determined by local assessors to be the total taxable value of land and additions on the property. | Land | Improvement |
|---|---|---|---|---|
| 2025 | $1,776 | $107,570 | $1,960 | $105,610 |
| 2024 | $1,776 | $99,790 | $1,840 | $97,950 |
| 2023 | $1,466 | $99,790 | $1,840 | $97,950 |
| 2022 | $1,216 | $73,500 | $1,840 | $71,660 |
| 2021 | $1,216 | $63,540 | $1,840 | $61,700 |
| 2020 | $1,132 | $58,240 | $1,840 | $56,400 |
| 2019 | $1,046 | $58,240 | $1,840 | $56,400 |
| 2018 | $1,014 | $56,220 | $0 | $0 |
| 2017 | $1,014 | $53,840 | $0 | $0 |
| 2016 | $970 | $53,840 | $0 | $0 |
| 2015 | $970 | $38,430 | $0 | $0 |
| 2014 | $678 | $38,430 | $0 | $0 |
Source: Public Records
Map
Nearby Homes
- 3928 Xavier Ave
- 0 390th Street & Zeller Ave Unit 11563731
- 11900 Olympic Ave
- 1400 W Main St
- 204 N 2nd St
- 712 W Main St
- 418 W Washington St
- 605 S West St
- 301 W South St
- 319 W Jefferson St
- 209 W Monroe St
- 614 E Madison St
- 0 S State Rd Unit 211290
- 00 N State Rd
- 229 N State Rd
- 228 S State Rd
- 0 160th St
- 209 S Lake St
- 941 6th St
- 116 Vine St