
Seller's Agent in 2025
Joseph C Jackson
Keller Williams Capital Ptnrs
(614) 888-1000
30 in this area
187 Total Sales
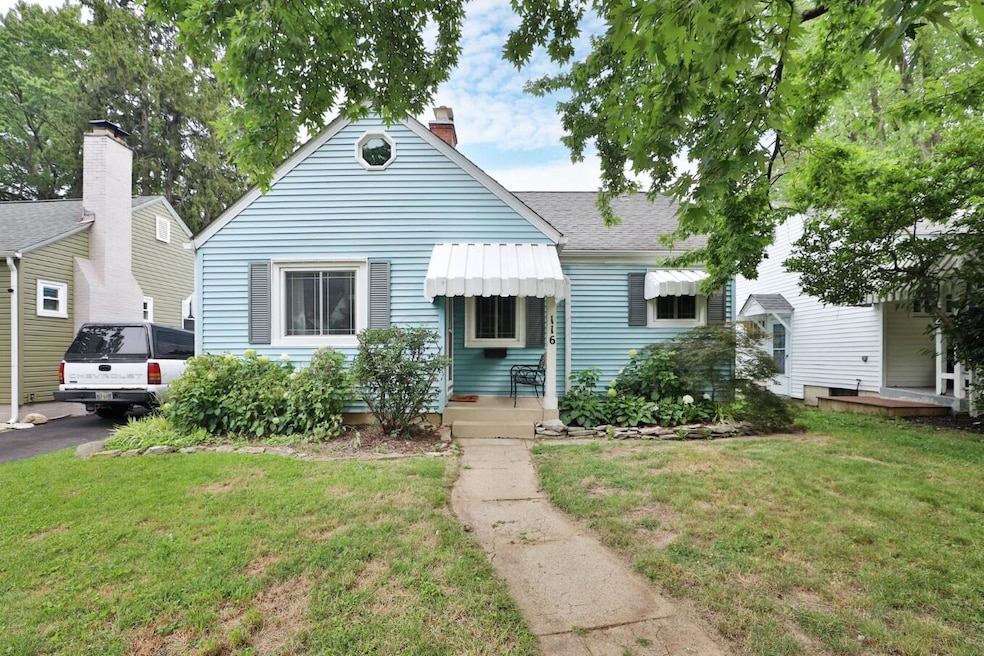
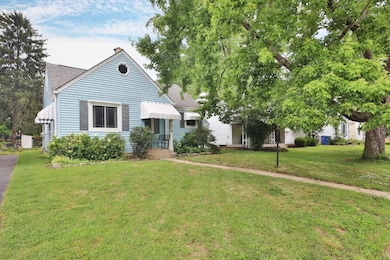
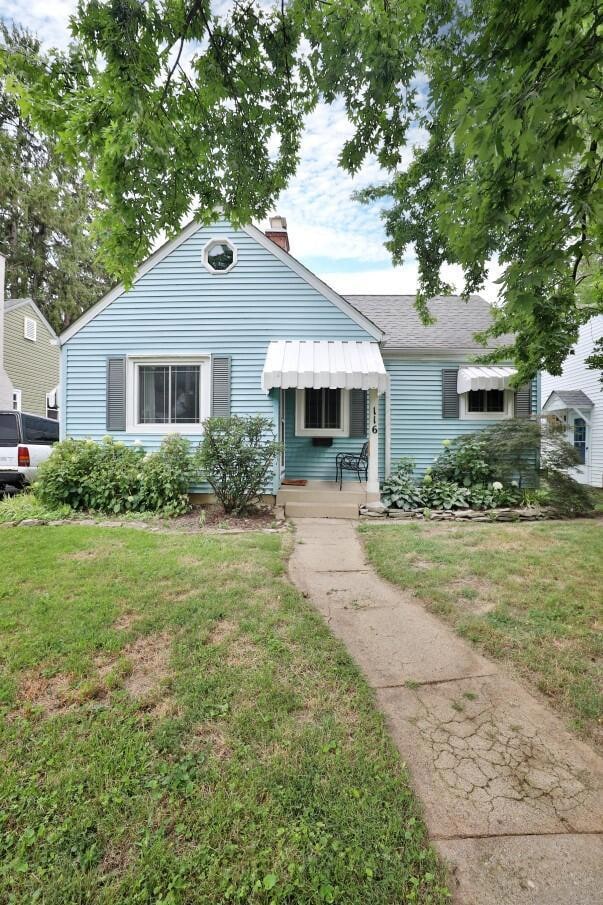
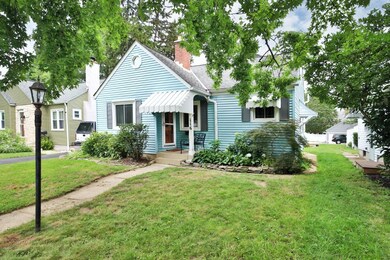

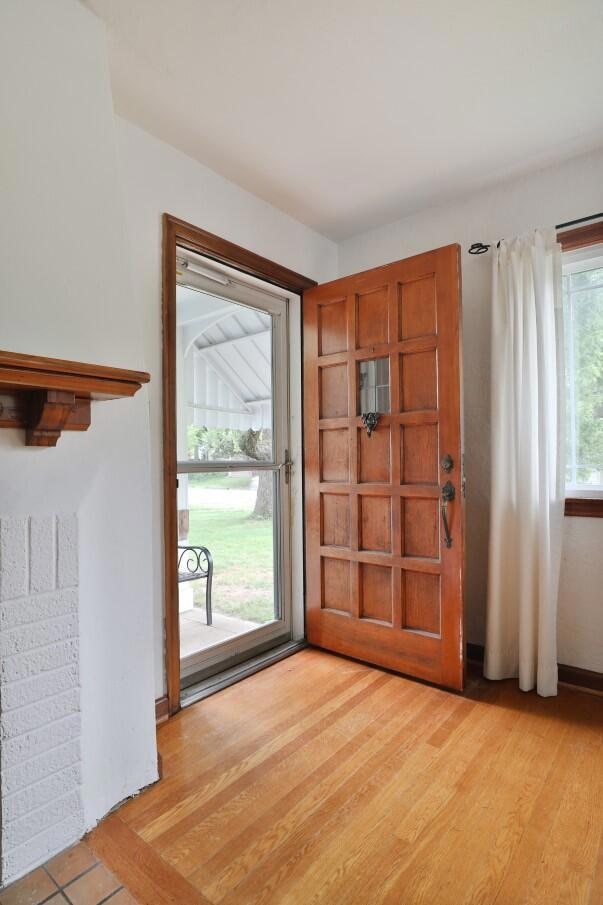
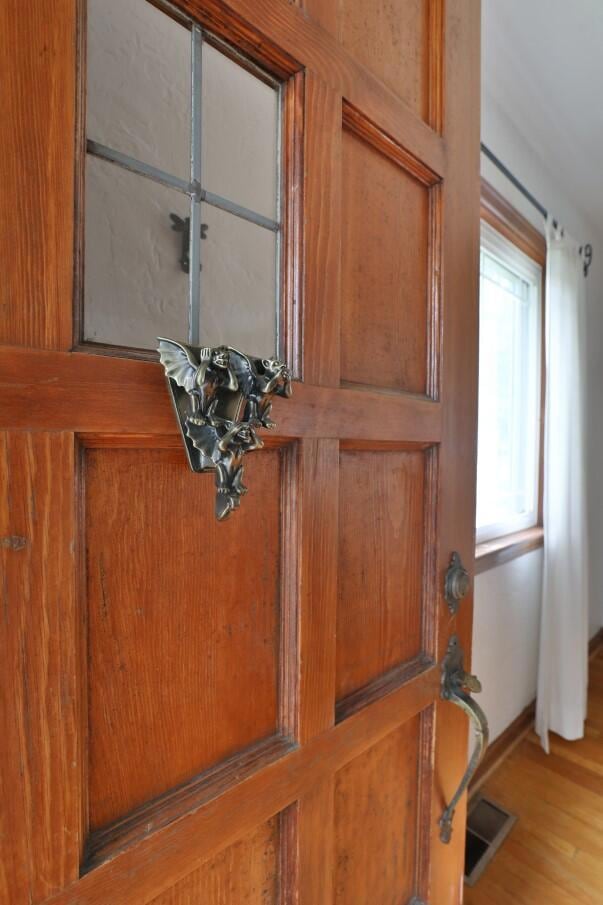
OUTSTANDING Move In Ready Opportunity in North Clintonville! Here's your chance to leap into homeownership with this well-cared-for gem located in Delawanda—one of Clintonville's quietest and most charming neighborhoods. Tucked away on a peaceful street, yet just moments from Graceland shopping and all the vibrant amenities Clintonville has to offer. This home features numerous updates, including a new HVAC system and windows (2018), a fully equipped kitchen with newer appliances, wired ethernet throughout the house, and upgraded electric system with dedicated garage subpanel. Beautiful hardwood floors run throughout the main level, and the finished basement adds valuable extra living space—plus a laundry area with a washer and dryer that stay! Step out back and enjoy your summer on the oversized rear deck—perfect for relaxing or entertaining.
Last Agent to Sell the Property
Keller Williams Capital Ptnrs License #2014000204 Listed on: 10/07/2025
| Date | Type | Sale Price | Title Company |
|---|---|---|---|
| Warranty Deed | $297,500 | Ohio Real Title | |
| Warranty Deed | $219,900 | Elite Land Title | |
| Survivorship Deed | $154,000 | Real Living | |
| Warranty Deed | $88,900 | Title First Agency Inc |
| Date | Status | Loan Amount | Loan Type |
|---|---|---|---|
| Open | $288,575 | New Conventional | |
| Previous Owner | $124,740 | New Conventional | |
| Previous Owner | $88,179 | FHA |
| Date | Event | Price | List to Sale | Price per Sq Ft |
|---|---|---|---|---|
| 12/01/2025 12/01/25 | Sold | $297,500 | -0.8% | $238 / Sq Ft |
| 11/13/2025 11/13/25 | Pending | -- | -- | -- |
| 10/28/2025 10/28/25 | Price Changed | $300,000 | -3.2% | $240 / Sq Ft |
| 09/19/2025 09/19/25 | Price Changed | $310,000 | -4.6% | $248 / Sq Ft |
| 09/03/2025 09/03/25 | Price Changed | $325,000 | -3.0% | $260 / Sq Ft |
| 07/08/2025 07/08/25 | For Sale | $335,000 | -- | $268 / Sq Ft |
| Year | Tax Paid | Tax Assessment Tax Assessment Total Assessment is a certain percentage of the fair market value that is determined by local assessors to be the total taxable value of land and additions on the property. | Land | Improvement |
|---|---|---|---|---|
| 2025 | $6,481 | $94,680 | $32,480 | $62,200 |
| 2024 | $6,481 | $94,680 | $32,480 | $62,200 |
| 2023 | $4,285 | $94,675 | $32,480 | $62,195 |
| 2022 | $4,098 | $77,110 | $14,460 | $62,650 |
| 2021 | $4,105 | $77,110 | $14,460 | $62,650 |
| 2020 | $4,012 | $77,110 | $14,460 | $62,650 |
| 2019 | $3,605 | $59,430 | $11,130 | $48,300 |
| 2018 | $3,102 | $54,780 | $11,130 | $43,650 |
| 2017 | $3,321 | $54,780 | $11,130 | $43,650 |
| 2016 | $3,181 | $48,020 | $15,120 | $32,900 |
| 2015 | $2,888 | $48,020 | $15,120 | $32,900 |
| 2014 | $2,895 | $48,020 | $15,120 | $32,900 |
| 2013 | $1,359 | $45,710 | $14,385 | $31,325 |
Seller's Agent in 2025
Joseph C Jackson
Keller Williams Capital Ptnrs
(614) 888-1000
30 in this area
187 Total Sales
Seller Co-Listing Agent in 2025
Debra Patterson McGuire
Keller Williams Capital Ptnrs
(614) 571-4663
15 in this area
63 Total Sales
Buyer's Agent in 2025
Lacey Wheeler
Red 1 Realty
(614) 530-7617
28 in this area
464 Total Sales
Buyer Co-Listing Agent in 2025
Kimberly Kirtland
Red 1 Realty
(614) 858-3793
2 in this area
47 Total Sales
Source: Columbus and Central Ohio Regional MLS
MLS Number: 225024765
APN: 010-109870
Disclaimer: Certain information contained herein is derived from information provided by parties other than Homes.com. All information provided is deemed reliable, but is not guaranteed to be accurate and should be independently verified.
![]() IDX information is provided exclusively for personal, non-commercial use, and may not be used for any purpose other than to identify prospective properties consumers may be interested in purchasing.
IDX information is provided exclusively for personal, non-commercial use, and may not be used for any purpose other than to identify prospective properties consumers may be interested in purchasing.
Information is deemed reliable but not guaranteed.
Ask me questions while you tour the home.