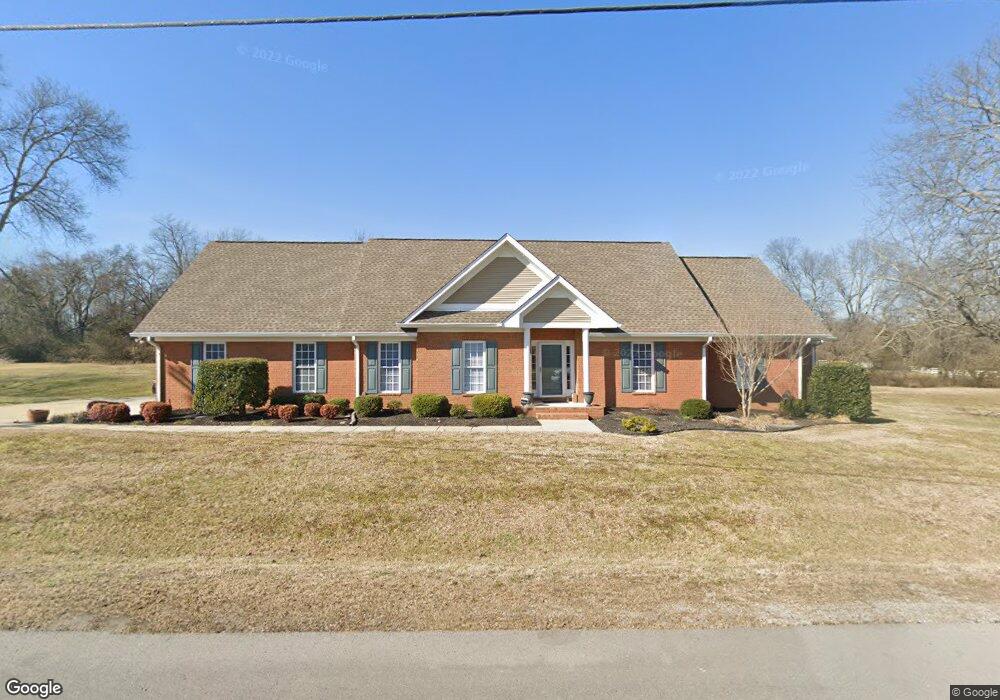
116 River Downs Blvd Murfreesboro, TN 37128
Estimated Value: $480,000 - $549,000
Studio
--
Bath
2,186
Sq Ft
$240/Sq Ft
Est. Value
About This Home
This home is located at 116 River Downs Blvd, Murfreesboro, TN 37128 and is currently estimated at $523,560, approximately $239 per square foot. 116 River Downs Blvd is a home located in Rutherford County with nearby schools including Barfield Elementary School, Rockvale Middle School, and Rockvale High School.
Ownership History
Date
Name
Owned For
Owner Type
Purchase Details
Closed on
Mar 18, 2014
Sold by
Gillespie Matthew
Bought by
Johnson Raborn K Erica N
Current Estimated Value
Home Financials for this Owner
Home Financials are based on the most recent Mortgage that was taken out on this home.
Original Mortgage
$190,000
Outstanding Balance
$144,123
Interest Rate
4.36%
Mortgage Type
New Conventional
Estimated Equity
$379,438
Purchase Details
Closed on
Sep 9, 2005
Sold by
Womack David A and Womack Cheryle A
Bought by
Gillespie Matthew E and Gillespie Mary E
Home Financials for this Owner
Home Financials are based on the most recent Mortgage that was taken out on this home.
Original Mortgage
$175,600
Interest Rate
5.86%
Purchase Details
Closed on
Feb 14, 2005
Sold by
The Villages Of Scottland
Bought by
Womack David A
Create a Home Valuation Report for This Property
The Home Valuation Report is an in-depth analysis detailing your home's value as well as a comparison with similar homes in the area
Home Values in the Area
Average Home Value in this Area
Purchase History
| Date | Buyer | Sale Price | Title Company |
|---|---|---|---|
| Johnson Raborn K Erica N | $237,500 | -- | |
| Gillespie Matthew E | $219,500 | -- | |
| Womack David A | $27,500 | -- |
Source: Public Records
Mortgage History
| Date | Status | Borrower | Loan Amount |
|---|---|---|---|
| Open | Johnson Raborn K Erica N | $190,000 | |
| Previous Owner | Womack David A | $175,600 |
Source: Public Records
Tax History
| Year | Tax Paid | Tax Assessment Tax Assessment Total Assessment is a certain percentage of the fair market value that is determined by local assessors to be the total taxable value of land and additions on the property. | Land | Improvement |
|---|---|---|---|---|
| 2025 | $2,066 | $110,125 | $22,500 | $87,625 |
| 2024 | $2,066 | $110,125 | $22,500 | $87,625 |
| 2023 | $2,066 | $110,125 | $22,500 | $87,625 |
| 2022 | $1,780 | $110,125 | $22,500 | $87,625 |
| 2021 | $1,541 | $69,425 | $14,375 | $55,050 |
| 2020 | $1,541 | $69,425 | $14,375 | $55,050 |
| 2019 | $1,541 | $69,425 | $14,375 | $55,050 |
| 2018 | $1,458 | $69,425 | $0 | $0 |
| 2017 | $1,508 | $56,275 | $0 | $0 |
| 2016 | $1,508 | $56,275 | $0 | $0 |
| 2015 | $1,508 | $56,275 | $0 | $0 |
| 2014 | $1,399 | $56,275 | $0 | $0 |
| 2013 | -- | $60,625 | $0 | $0 |
Source: Public Records
Map
Nearby Homes
- 208 Oscar Ct
- 2696 Barfield Rd
- 6407 Desmond Ave
- 6421 Desmond Ave
- 2206 Faulkner Springs Dr
- 1976 Orchard Park Dr
- 103 Faldo Dr
- 0 Audubon Ln Unit GTRTBD
- 35 Audubon Ln
- 36 Audubon Ln
- 2111 Hideaway Ln
- 2119 Hideaway Ln
- 1455 Cotillion Dr
- 2308 Audubon Ln
- 2310 Audubon Ln Unit GTR053
- 2313 Audubon Ln
- 2312 Audubon Ln
- 2317 Audubon Ln
- 3503 Firerock Dr
- 3505 Firerock Dr
- 115 River Downs Blvd
- 111 River Downs Blvd
- 119 River Downs Blvd
- 107 River Downs Blvd
- 2462 Barfield Rd
- 103 River Downs Blvd
- 215 Oscar Ct
- 211 Oscar Ct
- 200 River Downs Blvd
- 2502 Barfield Rd
- 109 Shea St
- 104 Shea St
- 220 Oscar Ct
- 108 Shea St
- 212 Oscar Ct
- 206 River Downs Blvd
- 216 Oscar Ct
- 105 Oscar Ct
- 204 Oscar Ct
- 2442 Barfield Rd
Your Personal Tour Guide
Ask me questions while you tour the home.