Estimated Value: $280,792 - $1,551,000
1
Bed
1
Bath
1,130
Sq Ft
$742/Sq Ft
Est. Value
About This Home
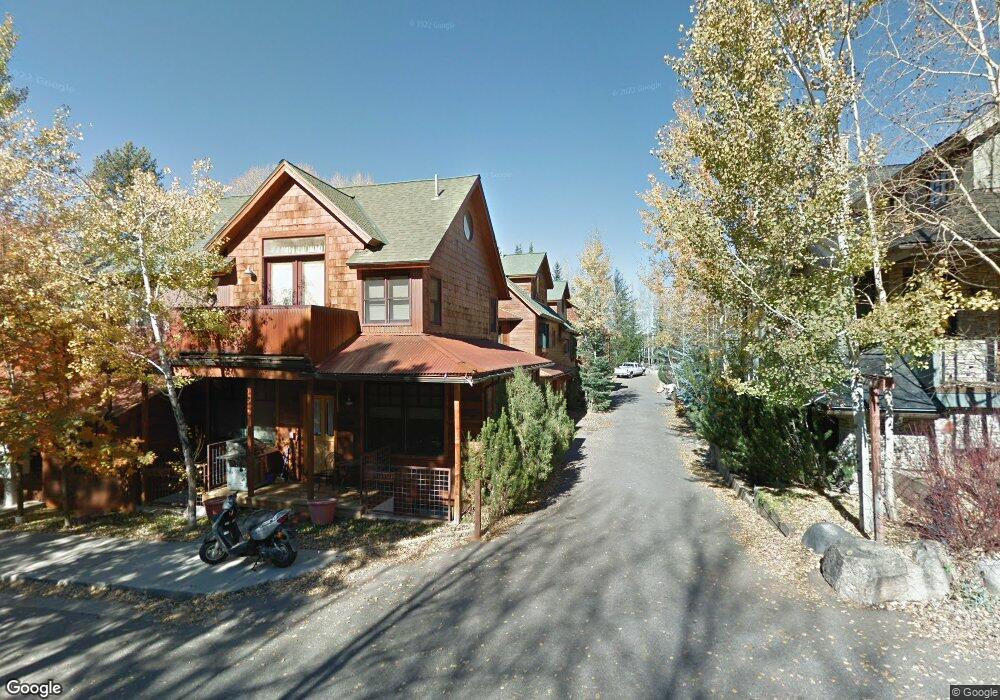
This home is located at 116 Robinson Rd Unit G, Aspen, CO 81611 and is currently estimated at $838,948, approximately $742 per square foot. 116 Robinson Rd Unit G is a home located in Pitkin County with nearby schools including Aspen Elementary School, Aspen Middle School, and Aspen High School.
Ownership History
Date
Name
Owned For
Owner Type
Purchase Details
Closed on
Oct 27, 2011
Sold by
Aspen/Pitkin County Housing Authority
Bought by
Faas Michael and Faas Mj Wolfe
Current Estimated Value
Home Financials for this Owner
Home Financials are based on the most recent Mortgage that was taken out on this home.
Original Mortgage
$165,775
Outstanding Balance
$111,563
Interest Rate
4.13%
Mortgage Type
New Conventional
Estimated Equity
$727,385
Purchase Details
Closed on
Oct 25, 2011
Sold by
Murphy Carlson Deanna R and Estate Of Charles Michales Car
Bought by
Aspen/Pitkin County Housing Authority
Home Financials for this Owner
Home Financials are based on the most recent Mortgage that was taken out on this home.
Original Mortgage
$165,775
Outstanding Balance
$111,563
Interest Rate
4.13%
Mortgage Type
New Conventional
Estimated Equity
$727,385
Purchase Details
Closed on
Dec 29, 2002
Sold by
Carlson Charles Michales
Bought by
Carlson Charles Michales and Murphy Carlson Deanna Rae
Create a Home Valuation Report for This Property
The Home Valuation Report is an in-depth analysis detailing your home's value as well as a comparison with similar homes in the area
Home Values in the Area
Average Home Value in this Area
Purchase History
| Date | Buyer | Sale Price | Title Company |
|---|---|---|---|
| Faas Michael | $165,844 | St | |
| Aspen/Pitkin County Housing Authority | -- | St | |
| Carlson Charles Michales | -- | -- |
Source: Public Records
Mortgage History
| Date | Status | Borrower | Loan Amount |
|---|---|---|---|
| Open | Faas Michael | $165,775 |
Source: Public Records
Tax History
| Year | Tax Paid | Tax Assessment Tax Assessment Total Assessment is a certain percentage of the fair market value that is determined by local assessors to be the total taxable value of land and additions on the property. | Land | Improvement |
|---|---|---|---|---|
| 2025 | $532 | $14,280 | $0 | $14,280 |
| 2024 | $532 | $10,620 | $0 | $10,620 |
| 2023 | $352 | $13,430 | $0 | $13,430 |
| 2022 | $479 | $12,930 | $0 | $12,930 |
| 2021 | $971 | $13,310 | $0 | $13,310 |
| 2020 | $471 | $13,050 | $0 | $13,050 |
| 2019 | $471 | $13,050 | $0 | $13,050 |
| 2018 | $848 | $13,140 | $0 | $13,140 |
| 2017 | $794 | $12,510 | $0 | $12,510 |
| 2016 | $883 | $13,820 | $0 | $13,820 |
| 2015 | $1,129 | $13,820 | $0 | $13,820 |
| 2014 | $454 | $13,370 | $0 | $13,370 |
Source: Public Records
Map
Nearby Homes
- 100 Park Ave
- 1195 E Cooper Ave Unit A
- 1345 Mayflower Ct
- 96 McSkimming Rd
- 1039 E Cooper Ave Unit 16A
- 1039 E Cooper Ave Unit 36B
- 1212 E Hopkins Ave
- 1024 E Cooper Ave Unit 2
- 71 & 73 Smuggler Grove Rd
- 63 Smuggler Grove
- 1001 E Cooper Ave Unit 1
- 1006 E Cooper Ave
- 322 Park Ave Unit 1
- 322 Park Ave Unit 2
- 326 Midland Ave Unit 302
- 326 Midland Ave Unit 308
- 326 Midland Ave Unit 306
- 939 E Cooper Ave Unit B
- 927 E Durant Ave Unit 3
- 926 Waters Ave Unit 203
- 118 Robinson Rd Unit H
- 114 Robinson Rd Unit J
- 110 Robinson Rd Unit D
- 112 Robinson Rd Unit I
- 108 Robinson Rd Unit E
- 106 Robinson Rd Unit F
- 115 Robinson Rd
- 102 Robinson Rd Unit B
- 121 Robinson Rd
- 100 Robinson Rd Unit C
- 104 Robinson Rd Unit A
- 127 Robinson Rd
- 133 Robinson Rd
- 313 Lacet Ct Unit 313
- 460 Alpine Ct
- 414H Alpine Ct
- 414A Alpine Ct
- 414 Alpine Ct
- 414D Alpine Ct
- 414B Alpine Ct
Your Personal Tour Guide
Ask me questions while you tour the home.