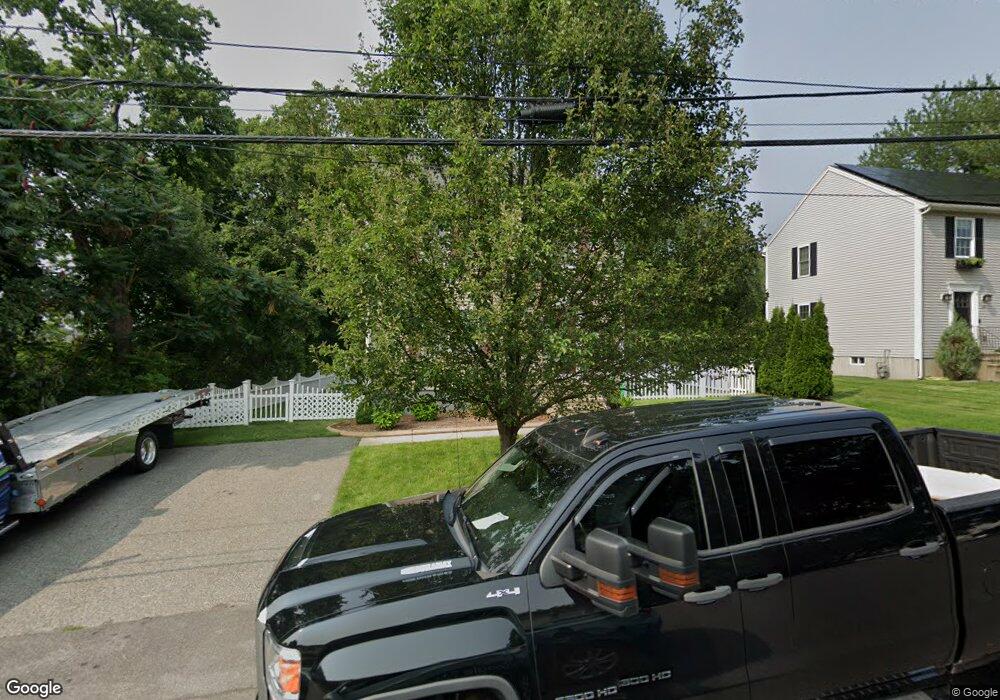
116 Slade St Fall River, MA 02724
Sandy Beach NeighborhoodEstimated Value: $400,885 - $452,000
3
Beds
2
Baths
1,321
Sq Ft
$317/Sq Ft
Est. Value
About This Home
This home is located at 116 Slade St, Fall River, MA 02724 and is currently estimated at $418,721, approximately $316 per square foot. 116 Slade St is a home located in Bristol County with nearby schools including Carlton M. Viveiros Elementary School, Matthew J. Kuss Middle School, and B M C Durfee High School.
Ownership History
Date
Name
Owned For
Owner Type
Purchase Details
Closed on
Jan 19, 2018
Sold by
Silva Jesse and Farias Ashley L
Bought by
Silva Jacinto T
Current Estimated Value
Purchase Details
Closed on
Apr 30, 2010
Sold by
Biszko Constr Svcs Inc
Bought by
Silva Jesse and Farias Ashley L
Home Financials for this Owner
Home Financials are based on the most recent Mortgage that was taken out on this home.
Original Mortgage
$204,300
Interest Rate
4.99%
Mortgage Type
Purchase Money Mortgage
Purchase Details
Closed on
Jun 17, 2009
Sold by
Jmd Land Co Llc
Bought by
Biszko Constr Svcs Inc
Create a Home Valuation Report for This Property
The Home Valuation Report is an in-depth analysis detailing your home's value as well as a comparison with similar homes in the area
Home Values in the Area
Average Home Value in this Area
Purchase History
| Date | Buyer | Sale Price | Title Company |
|---|---|---|---|
| Silva Jacinto T | $230,000 | -- | |
| Silva Jesse | $227,000 | -- | |
| Biszko Constr Svcs Inc | -- | -- |
Source: Public Records
Mortgage History
| Date | Status | Borrower | Loan Amount |
|---|---|---|---|
| Previous Owner | Silva Jesse | $204,300 |
Source: Public Records
Tax History
| Year | Tax Paid | Tax Assessment Tax Assessment Total Assessment is a certain percentage of the fair market value that is determined by local assessors to be the total taxable value of land and additions on the property. | Land | Improvement |
|---|---|---|---|---|
| 2025 | $3,689 | $322,200 | $108,000 | $214,200 |
| 2024 | $3,463 | $301,400 | $104,000 | $197,400 |
| 2023 | $3,638 | $296,500 | $85,900 | $210,600 |
| 2022 | $3,202 | $253,700 | $81,800 | $171,900 |
| 2021 | $3,121 | $225,700 | $77,800 | $147,900 |
| 2020 | $3,108 | $215,100 | $76,700 | $138,400 |
| 2019 | $3,014 | $206,700 | $73,900 | $132,800 |
| 2018 | $2,988 | $204,400 | $80,000 | $124,400 |
| 2017 | $2,778 | $198,400 | $76,300 | $122,100 |
| 2016 | $2,669 | $195,800 | $81,100 | $114,700 |
| 2015 | $2,589 | $197,900 | $81,100 | $116,800 |
| 2014 | $2,461 | $195,600 | $78,800 | $116,800 |
Source: Public Records
Map
Nearby Homes
- 245 Dwelly St
- 464 Birch St
- 609 King Philip St
- 20 Wilcox St
- 1852 S Main St
- 1846 S Main St
- 24 Valley St
- 616 Woodman St
- 15 Higgins St
- 57 Larouche St
- 126 Wheeler St
- 2229 S Main St
- 234 Kilburn St
- 1334 S Main St
- 917 Dwelly St
- 1273-1279 S Main St
- 70 Brown St
- 344-354 E Main St
- 579 Summit St Unit 3
- 579 Summit St Unit 2
Your Personal Tour Guide
Ask me questions while you tour the home.