Estimated Value: $150,000 - $211,158
3
Beds
2
Baths
996
Sq Ft
$189/Sq Ft
Est. Value
About This Home
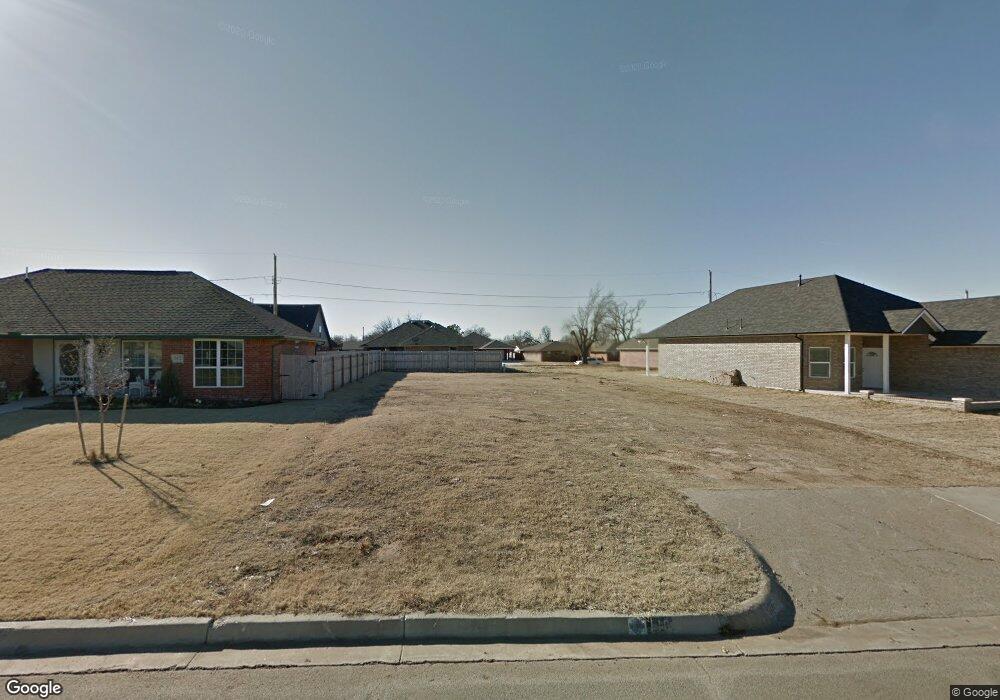
This home is located at 116 SW 8th St, Moore, OK 73160 and is currently estimated at $188,040, approximately $188 per square foot. 116 SW 8th St is a home located in Cleveland County with nearby schools including Central Elementary School, Central Junior High School, and Moore High School.
Ownership History
Date
Name
Owned For
Owner Type
Purchase Details
Closed on
Feb 26, 2016
Sold by
Asbiney Llc
Bought by
Mby And Nly Legacy Llc
Current Estimated Value
Purchase Details
Closed on
Oct 10, 2013
Sold by
Williams Paul and Williams Danielle
Bought by
Asbiney Llc
Home Financials for this Owner
Home Financials are based on the most recent Mortgage that was taken out on this home.
Original Mortgage
$12,325
Interest Rate
4.54%
Mortgage Type
Future Advance Clause Open End Mortgage
Purchase Details
Closed on
Jul 31, 2007
Sold by
Jackson Alphonso
Bought by
Williams Paul
Home Financials for this Owner
Home Financials are based on the most recent Mortgage that was taken out on this home.
Original Mortgage
$65,555
Interest Rate
6.69%
Mortgage Type
New Conventional
Purchase Details
Closed on
Aug 27, 2002
Sold by
Mangini Jennifer
Bought by
Hood Floyd R
Create a Home Valuation Report for This Property
The Home Valuation Report is an in-depth analysis detailing your home's value as well as a comparison with similar homes in the area
Home Values in the Area
Average Home Value in this Area
Purchase History
| Date | Buyer | Sale Price | Title Company |
|---|---|---|---|
| Mby And Nly Legacy Llc | -- | None Available | |
| Asbiney Llc | $17,500 | None Available | |
| Williams Paul | -- | None Available | |
| Hood Floyd R | $64,000 | -- |
Source: Public Records
Mortgage History
| Date | Status | Borrower | Loan Amount |
|---|---|---|---|
| Previous Owner | Asbiney Llc | $12,325 | |
| Previous Owner | Williams Paul | $65,555 |
Source: Public Records
Tax History
| Year | Tax Paid | Tax Assessment Tax Assessment Total Assessment is a certain percentage of the fair market value that is determined by local assessors to be the total taxable value of land and additions on the property. | Land | Improvement |
|---|---|---|---|---|
| 2025 | $2,543 | $20,774 | $2,704 | $18,070 |
| 2023 | $2,297 | $18,843 | $2,623 | $16,220 |
| 2022 | $2,220 | $17,945 | $2,743 | $15,202 |
| 2021 | $2,124 | $17,091 | $1,920 | $15,171 |
| 2020 | $2,073 | $16,670 | $1,920 | $14,750 |
| 2019 | $2,098 | $16,571 | $1,920 | $14,651 |
| 2018 | $2,169 | $17,124 | $1,920 | $15,204 |
| 2017 | $159 | $1,920 | $0 | $0 |
| 2016 | $152 | $1,191 | $1,191 | $0 |
| 2015 | -- | $1,134 | $1,134 | $0 |
| 2014 | -- | $1,080 | $1,080 | $0 |
Source: Public Records
Map
Nearby Homes
- 112 SW 6th St
- 128 SW 6th St
- 117 SW 6th St
- 1205 S Howard Ave
- 1105 Golden Leaf Dr
- 833 Glenwood Dr
- 401 SE 10th St
- 317 Stoneridge Dr
- 1605 S Broadway Ave
- 317 SE 6th St
- 502 Stoneridge Dr
- 519 Stoneridge Dr
- 508 Saint Charles Cir
- 525 SW 2nd St
- 608 SW 15th St
- 729 Saint Charles St
- 1301 Heather Ln
- 504 Armstrong St
- 601 Wood Crest St
- 1605 Glenwood Dr
Your Personal Tour Guide
Ask me questions while you tour the home.