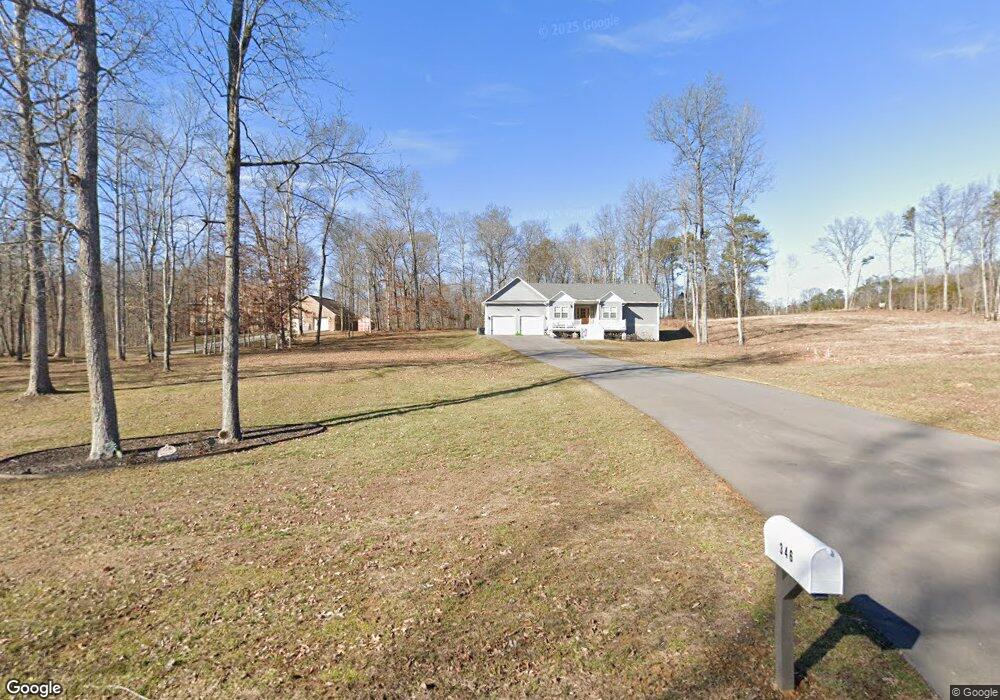
116 SW Tom Patterson Trail Dandridge, TN 37725
Estimated Value: $494,178 - $764,000
--
Bed
--
Bath
2,688
Sq Ft
$217/Sq Ft
Est. Value
About This Home
This home is located at 116 SW Tom Patterson Trail, Dandridge, TN 37725 and is currently estimated at $584,545, approximately $217 per square foot. 116 SW Tom Patterson Trail is a home.
Ownership History
Date
Name
Owned For
Owner Type
Purchase Details
Closed on
Sep 30, 2022
Sold by
Brooks Development Company Gp
Bought by
Smith Austin and Smith Timber
Current Estimated Value
Home Financials for this Owner
Home Financials are based on the most recent Mortgage that was taken out on this home.
Original Mortgage
$318,750
Outstanding Balance
$304,667
Interest Rate
5.13%
Mortgage Type
New Conventional
Estimated Equity
$279,878
Purchase Details
Closed on
Feb 17, 2022
Sold by
Smith Austin T & Timber A Kraklau
Bought by
Brooks Development Company Gp
Purchase Details
Closed on
Jun 24, 2013
Sold by
Developm Wells Spring Land
Bought by
Koopman Peter L and Koopman Beatriz E
Purchase Details
Closed on
May 4, 2007
Sold by
Koopman Peter L and Koopman Beatriz E
Bought by
Koopman Peter L and Koopman Beatriz E
Purchase Details
Closed on
Feb 8, 2007
Sold by
Koopman Peter L and Koopman Beatriz E
Bought by
Koopman Peter L and Koopman Beatriz E
Create a Home Valuation Report for This Property
The Home Valuation Report is an in-depth analysis detailing your home's value as well as a comparison with similar homes in the area
Home Values in the Area
Average Home Value in this Area
Purchase History
| Date | Buyer | Sale Price | Title Company |
|---|---|---|---|
| Smith Austin | $375,000 | Smoky Mountain Title | |
| Brooks Development Company Gp | $45,000 | Smoky Mountain Title | |
| Koopman Peter L | $76,450 | -- | |
| Koopman Peter L | $61,000 | -- | |
| Koopman Peter L | $712,500 | -- |
Source: Public Records
Mortgage History
| Date | Status | Borrower | Loan Amount |
|---|---|---|---|
| Open | Smith Austin | $318,750 |
Source: Public Records
Tax History Compared to Growth
Tax History
| Year | Tax Paid | Tax Assessment Tax Assessment Total Assessment is a certain percentage of the fair market value that is determined by local assessors to be the total taxable value of land and additions on the property. | Land | Improvement |
|---|---|---|---|---|
| 2025 | $1,655 | $141,350 | $10,000 | $131,350 |
| 2023 | $1,655 | $71,950 | $0 | $0 |
| 2022 | $60 | $2,750 | $2,750 | $0 |
| 2021 | $60 | $2,750 | $2,750 | $0 |
| 2020 | $60 | $2,750 | $2,750 | $0 |
| 2019 | $60 | $2,750 | $2,750 | $0 |
| 2018 | $65 | $2,750 | $2,750 | $0 |
| 2017 | $65 | $2,750 | $2,750 | $0 |
| 2016 | $65 | $2,750 | $2,750 | $0 |
| 2015 | $65 | $2,750 | $2,750 | $0 |
| 2014 | -- | $2,750 | $2,750 | $0 |
Source: Public Records
Map
Nearby Homes
- 252 Slaton Farm Rd
- 216 Slaton Farm Rd
- 1467 Squire Fox Rd
- 1451 Squire Fox Rd
- 1126 Sunshine Dr
- 1527 Squire Fox Rd
- 539 Morie Rd
- 555 Green Hill Rd
- Lot 10 Antler Ridge
- lot 4 Saint John's Dr
- 603 Saint John's Dr
- 0 Antler Ridge Unit 1298515
- 839 Quiet Oaks Way
- 1830 Pheasant Crossing Dr
- 642 Privet Dr
- 1806 Pheasant Crossing Dr
- 825 Quiet Oaks Way
- 1887 Lakebrook Cir
- 225 St Jordan Dr
- 342 Tom Patterson Trail
- 24 Tom Patterson Trail
- 293 Tom Patterson Trail
- 1540 Tom Patterson Trail
- Lot 21 Tom Patterson Trail
- 319 Tom Patterson Trail
- 0 Tom Patterson Trail Unit 207397
- 0 Tom Patterson Trail Unit 1262851
- 0 Tom Patterson Trail Unit 1262850
- 0 Tom Patterson Trail Unit 1211543
- 0 Tom Patterson Trail Unit 1211436
- 0 Tom Patterson Trail Unit 606873
- 0 Tom Patterson Trail Unit 606876
- 0 Tom Patterson Trail Unit 606875
- 0 Tom Patterson Trail Unit 606874
- 0 Tom Patterson Trail Unit 606877
- 269 Slaton Farm Rd
- 12 Tom Patterson Trail
- 11 Tom Patterson Trail
- 558 Antrim Ln