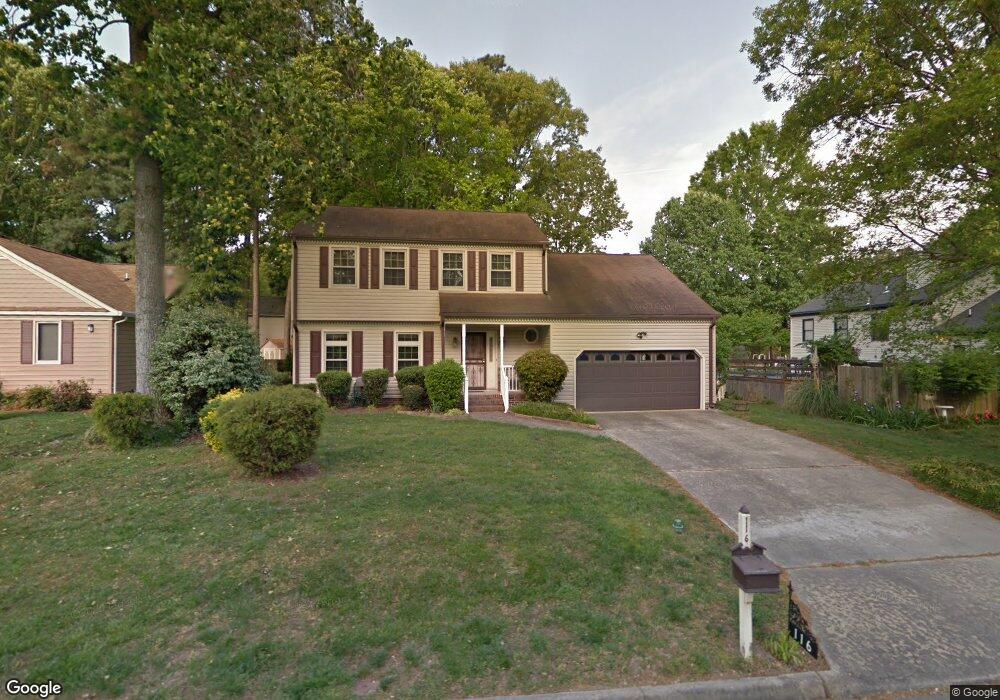
116 Vista Dr Newport News, VA 23608
Nelson NeighborhoodEstimated Value: $386,000 - $407,000
3
Beds
3
Baths
2,225
Sq Ft
$176/Sq Ft
Est. Value
About This Home
This home is located at 116 Vista Dr, Newport News, VA 23608 and is currently estimated at $392,145, approximately $176 per square foot. 116 Vista Dr is a home located in Newport News City with nearby schools including Knollwood Meadows Elementary School, Mary Passage Middle School, and Denbigh High School.
Ownership History
Date
Name
Owned For
Owner Type
Purchase Details
Closed on
Nov 10, 1998
Sold by
Krauss Marion L
Bought by
Starke Richard H
Current Estimated Value
Home Financials for this Owner
Home Financials are based on the most recent Mortgage that was taken out on this home.
Original Mortgage
$103,900
Outstanding Balance
$22,258
Interest Rate
6.65%
Estimated Equity
$369,887
Create a Home Valuation Report for This Property
The Home Valuation Report is an in-depth analysis detailing your home's value as well as a comparison with similar homes in the area
Home Values in the Area
Average Home Value in this Area
Purchase History
| Date | Buyer | Sale Price | Title Company |
|---|---|---|---|
| Starke Richard H | $129,900 | -- |
Source: Public Records
Mortgage History
| Date | Status | Borrower | Loan Amount |
|---|---|---|---|
| Open | Starke Richard H | $103,900 |
Source: Public Records
Tax History Compared to Growth
Tax History
| Year | Tax Paid | Tax Assessment Tax Assessment Total Assessment is a certain percentage of the fair market value that is determined by local assessors to be the total taxable value of land and additions on the property. | Land | Improvement |
|---|---|---|---|---|
| 2025 | $4,328 | $354,300 | $71,500 | $282,800 |
| 2024 | $4,181 | $354,300 | $71,500 | $282,800 |
| 2023 | $4,231 | $346,100 | $71,500 | $274,600 |
| 2022 | $3,929 | $315,200 | $71,500 | $243,700 |
| 2021 | $3,353 | $274,800 | $65,000 | $209,800 |
| 2020 | $3,221 | $252,000 | $65,000 | $187,000 |
| 2019 | $3,151 | $246,600 | $65,000 | $181,600 |
| 2018 | $3,062 | $239,600 | $65,000 | $174,600 |
| 2017 | $2,923 | $228,200 | $65,000 | $163,200 |
| 2016 | $2,919 | $228,200 | $65,000 | $163,200 |
| 2015 | $2,818 | $220,400 | $65,000 | $155,400 |
| 2014 | $2,473 | $220,400 | $65,000 | $155,400 |
Source: Public Records
Map
Nearby Homes