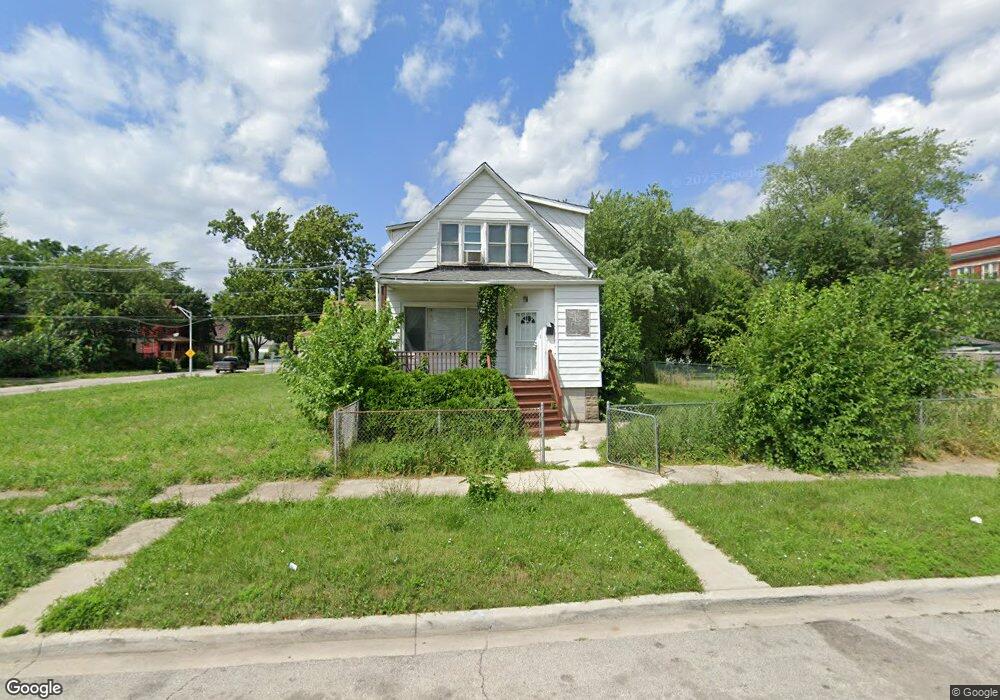
116 W 118th St Unit 118 Chicago, IL 60628
West Pullman NeighborhoodEstimated Value: $298,000
5
Beds
2
Baths
--
Sq Ft
0.72
Acres
About This Home
This home is located at 116 W 118th St Unit 118, Chicago, IL 60628 and is currently estimated at $298,000. 116 W 118th St Unit 118 is a home located in Cook County with nearby schools including Curtis Elementary School, Fenger Academy High School, and Chicago Collegiate Charter School.
Ownership History
Date
Name
Owned For
Owner Type
Purchase Details
Closed on
Aug 15, 2025
Sold by
Tucci Properties Gael Dr Llc
Bought by
Garcia Sarai and Mendoza Omar
Current Estimated Value
Purchase Details
Closed on
May 14, 2013
Sold by
Chicago Title Land Trust Co
Bought by
Person Evan
Purchase Details
Closed on
Mar 26, 2009
Sold by
Higgins Patrick
Bought by
Founders Bank & Trust #5 & 1150
Purchase Details
Closed on
Aug 5, 2008
Sold by
Wells Fargo Bank Na
Bought by
Higgins Patrick
Purchase Details
Closed on
Oct 15, 2007
Sold by
Collier
Bought by
Wells Fargo Bank Na
Purchase Details
Closed on
Aug 28, 2006
Sold by
Respress Melvin D
Bought by
Collier Patrick
Home Financials for this Owner
Home Financials are based on the most recent Mortgage that was taken out on this home.
Original Mortgage
$161,500
Interest Rate
9.75%
Mortgage Type
Unknown
Create a Home Valuation Report for This Property
The Home Valuation Report is an in-depth analysis detailing your home's value as well as a comparison with similar homes in the area
Home Values in the Area
Average Home Value in this Area
Purchase History
| Date | Buyer | Sale Price | Title Company |
|---|---|---|---|
| Garcia Sarai | -- | None Listed On Document | |
| Person Evan | $2,000 | Stewart Title Company | |
| Founders Bank & Trust #5 & 1150 | -- | None Available | |
| Higgins Patrick | $22,000 | 1St American Title | |
| Wells Fargo Bank Na | -- | None Available | |
| Collier Patrick | $170,000 | None Available |
Source: Public Records
Mortgage History
| Date | Status | Borrower | Loan Amount |
|---|---|---|---|
| Previous Owner | Collier Patrick | $161,500 |
Source: Public Records
Tax History Compared to Growth
Tax History
| Year | Tax Paid | Tax Assessment Tax Assessment Total Assessment is a certain percentage of the fair market value that is determined by local assessors to be the total taxable value of land and additions on the property. | Land | Improvement |
|---|---|---|---|---|
| 2024 | $291 | $2,030 | $1,875 | $155 |
| 2023 | $283 | $1,374 | $1,250 | $124 |
| 2022 | $283 | $1,374 | $1,250 | $124 |
| 2021 | $277 | $1,374 | $1,250 | $124 |
| 2020 | $411 | $1,842 | $1,718 | $124 |
| 2019 | $371 | $1,842 | $1,718 | $124 |
| 2018 | $365 | $1,842 | $1,718 | $124 |
| 2017 | $364 | $1,686 | $1,562 | $124 |
| 2016 | $338 | $1,686 | $1,562 | $124 |
| 2015 | $310 | $1,686 | $1,562 | $124 |
| 2014 | $285 | $1,530 | $1,406 | $124 |
| 2013 | $279 | $1,530 | $1,406 | $124 |
Source: Public Records
Map
Nearby Homes
- 58 W 118th St
- 11720 S La Salle St
- 11747 S Lafayette Ave
- 11845 S Perry Ave
- 11709 S Lafayette Ave
- 209 W 117th St
- 11842 S State St
- 15 E 118th St
- 22 E 118th St
- 11922 S Perry Ave
- 11578 S Perry Ave
- 11921 S Wentworth Ave
- 27 E 117th Place
- 11645 S Yale Ave
- 11577 S La Salle St
- 11935 S Perry Ave
- 11941 S La Salle St
- 255 W 117th St
- 244 W 117th St
- 11944 S Perry Ave
- 112 W 118th St
- 108 W 118th St
- 124 W 118th St
- 11745 S La Salle St
- 104 W 118th St
- 11743 S La Salle St
- 11742 S Perry Ave
- 11742 S Perry Ave
- 11739 S La Salle St
- 132 W 118th St
- 117 W 118th St Unit 1
- 117 W 118th St
- 11735 S La Salle St
- 119 W 118th St
- 111 W 118th St Unit 1
- 11738 S Perry Ave
- 123 W 118th St
- 134 W 118th St
- 107 W 118th St
- 107 W 118th St