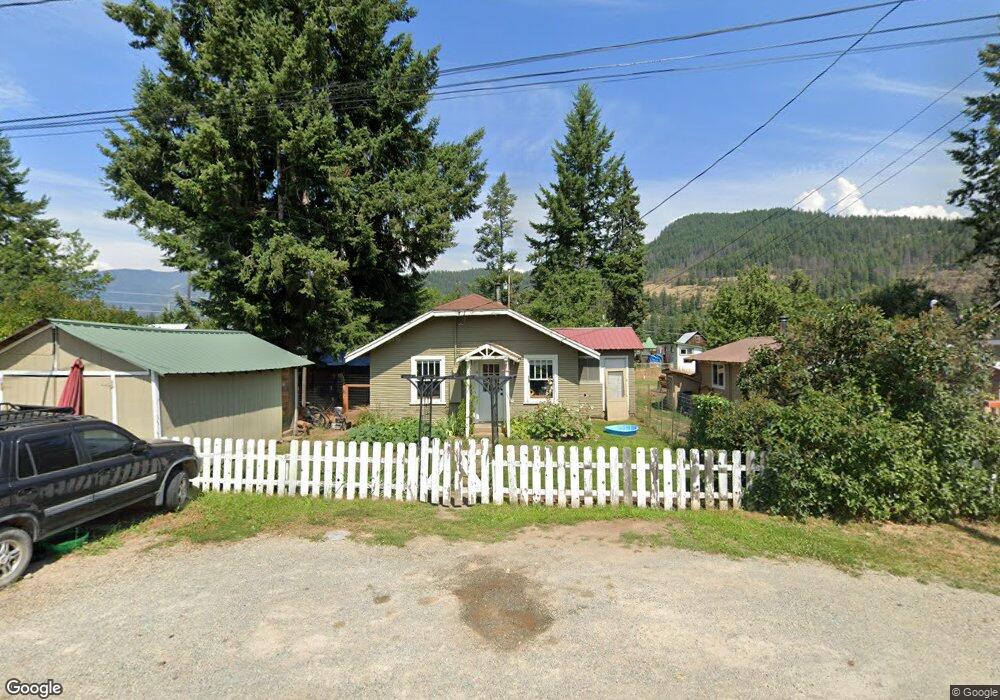
116 W 9th Ave Clark Fork, ID 83811
Estimated Value: $198,000 - $314,000
2
Beds
1
Bath
572
Sq Ft
$474/Sq Ft
Est. Value
About This Home
This home is located at 116 W 9th Ave, Clark Fork, ID 83811 and is currently estimated at $270,891, approximately $473 per square foot. 116 W 9th Ave is a home located in Bonner County with nearby schools including Hope Elementary School and Clark Fork Junior/Senior High School.
Ownership History
Date
Name
Owned For
Owner Type
Purchase Details
Closed on
Nov 4, 2009
Sold by
Federal National Mortgage Association
Bought by
Carlson John R
Current Estimated Value
Purchase Details
Closed on
Feb 9, 2009
Sold by
Hazel Ron
Bought by
Federal National Mortgage Association
Purchase Details
Closed on
Aug 18, 2005
Sold by
Johnson David L and Johnson Kathy L
Bought by
Hazel Ron
Home Financials for this Owner
Home Financials are based on the most recent Mortgage that was taken out on this home.
Original Mortgage
$104,000
Interest Rate
5.61%
Mortgage Type
New Conventional
Purchase Details
Closed on
Feb 22, 2005
Sold by
Johnson David L
Bought by
Johnson David L and Johnson Kathy L
Home Financials for this Owner
Home Financials are based on the most recent Mortgage that was taken out on this home.
Original Mortgage
$58,000
Interest Rate
5.73%
Mortgage Type
Future Advance Clause Open End Mortgage
Create a Home Valuation Report for This Property
The Home Valuation Report is an in-depth analysis detailing your home's value as well as a comparison with similar homes in the area
Home Values in the Area
Average Home Value in this Area
Purchase History
| Date | Buyer | Sale Price | Title Company |
|---|---|---|---|
| Carlson John R | -- | -- | |
| Federal National Mortgage Association | $110,880 | -- | |
| Hazel Ron | -- | None Available | |
| Johnson David L | -- | None Available |
Source: Public Records
Mortgage History
| Date | Status | Borrower | Loan Amount |
|---|---|---|---|
| Previous Owner | Hazel Ron | $104,000 | |
| Previous Owner | Johnson David L | $58,000 |
Source: Public Records
Tax History
| Year | Tax Paid | Tax Assessment Tax Assessment Total Assessment is a certain percentage of the fair market value that is determined by local assessors to be the total taxable value of land and additions on the property. | Land | Improvement |
|---|---|---|---|---|
| 2025 | $1,511 | $230,144 | $126,264 | $103,880 |
| 2024 | $1,610 | $248,764 | $145,764 | $103,000 |
| 2023 | $1,546 | $234,710 | $145,764 | $88,946 |
| 2022 | $1,325 | $170,851 | $75,176 | $95,675 |
| 2021 | $1,282 | $114,517 | $58,260 | $56,257 |
| 2020 | $1,184 | $93,364 | $48,588 | $44,776 |
| 2019 | $1,035 | $97,191 | $48,588 | $48,603 |
| 2018 | $1,001 | $88,757 | $48,572 | $40,185 |
| 2017 | $1,001 | $82,429 | $0 | $0 |
| 2016 | $778 | $56,688 | $0 | $0 |
| 2015 | $727 | $51,204 | $0 | $0 |
| 2014 | $675 | $45,383 | $0 | $0 |
Source: Public Records
Map
Nearby Homes
- 109 W 6th Ave
- 517 N Stephen St
- 60317 Idaho 200
- NNA Hwy 200
- 210 W 3rd Ave
- nna Lightning Creek Rd
- 102 E 2nd Ave
- 16 Elk Horn
- 103 N Stephen St
- NKA Silver Creek Rd
- 53465 Idaho 200
- 241 N River Lake Dr
- 374 Carbine Dr
- 526 Mountain View Rd
- 940 Sled Run Trail
- 582 Mountain View Rd
- 123 E Mountain View Rd
- 76 Shadow Valley Ln
- 58250 Idaho 200
- Tract 3 Usfs 2294
Your Personal Tour Guide
Ask me questions while you tour the home.