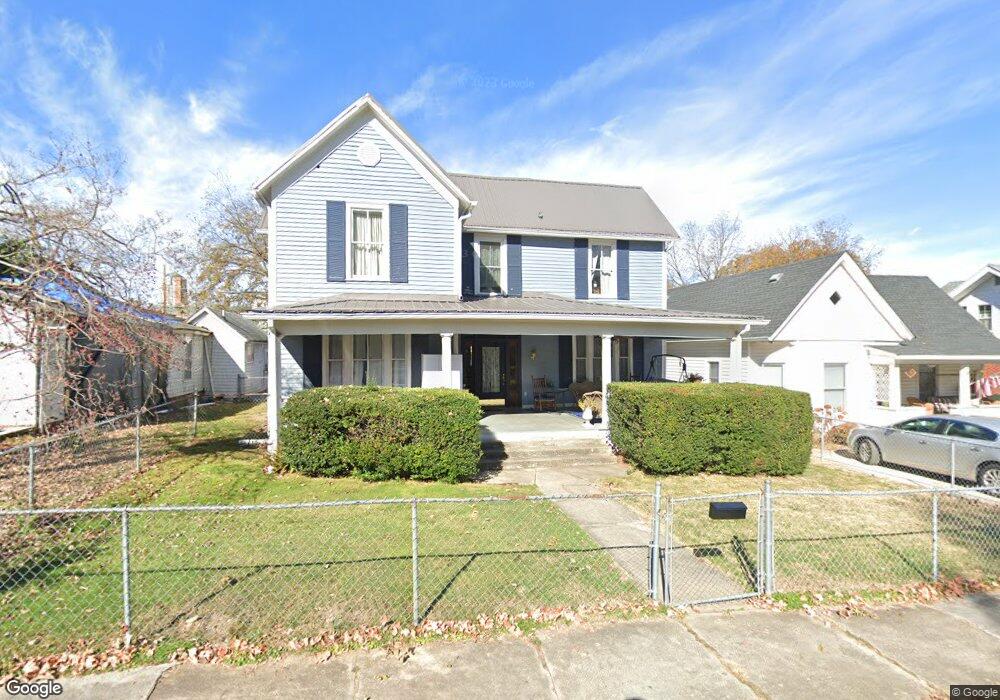
116 W Locust St Johnson City, TN 37604
South Side Johnson City NeighborhoodEstimated Value: $159,000 - $297,000
--
Bed
2
Baths
2,282
Sq Ft
$95/Sq Ft
Est. Value
About This Home
This home is located at 116 W Locust St, Johnson City, TN 37604 and is currently estimated at $217,543, approximately $95 per square foot. 116 W Locust St is a home located in Washington County with nearby schools including South Side Elementary School, Liberty Bell Middle School, and Indian Trail Middle School.
Ownership History
Date
Name
Owned For
Owner Type
Purchase Details
Closed on
Apr 28, 2023
Sold by
Ferguson John Fred and Ferguson Deborah Kay
Bought by
Keller-Ferguson Ginger
Current Estimated Value
Home Financials for this Owner
Home Financials are based on the most recent Mortgage that was taken out on this home.
Original Mortgage
$104,000
Outstanding Balance
$93,202
Interest Rate
5.9%
Mortgage Type
New Conventional
Estimated Equity
$124,342
Purchase Details
Closed on
Jan 22, 1999
Bought by
Ferguson John F and Ferguson Deborah Keller
Purchase Details
Closed on
Oct 14, 1996
Sold by
Douglas Verna
Bought by
Brock Jill
Purchase Details
Closed on
Mar 10, 1993
Bought by
Douglas Verna
Purchase Details
Closed on
Feb 8, 1982
Create a Home Valuation Report for This Property
The Home Valuation Report is an in-depth analysis detailing your home's value as well as a comparison with similar homes in the area
Home Values in the Area
Average Home Value in this Area
Purchase History
| Date | Buyer | Sale Price | Title Company |
|---|---|---|---|
| Keller-Ferguson Ginger | $130,000 | None Listed On Document | |
| Keller-Ferguson Ginger | $130,000 | None Listed On Document | |
| Ferguson John F | $65,800 | -- | |
| Brock Jill | $58,500 | -- | |
| Douglas Verna | $48,000 | -- | |
| -- | $27,500 | -- |
Source: Public Records
Mortgage History
| Date | Status | Borrower | Loan Amount |
|---|---|---|---|
| Open | Keller-Ferguson Ginger | $104,000 | |
| Closed | Keller-Ferguson Ginger | $104,000 |
Source: Public Records
Tax History Compared to Growth
Tax History
| Year | Tax Paid | Tax Assessment Tax Assessment Total Assessment is a certain percentage of the fair market value that is determined by local assessors to be the total taxable value of land and additions on the property. | Land | Improvement |
|---|---|---|---|---|
| 2024 | $778 | $45,500 | $7,825 | $37,675 |
| 2022 | $697 | $32,425 | $3,450 | $28,975 |
| 2021 | $1,258 | $32,425 | $3,450 | $28,975 |
| 2020 | $1,251 | $32,425 | $3,450 | $28,975 |
| 2019 | $690 | $32,425 | $3,450 | $28,975 |
| 2018 | $1,238 | $28,975 | $3,450 | $25,525 |
| 2017 | $1,238 | $28,975 | $3,450 | $25,525 |
| 2016 | $1,232 | $28,975 | $3,450 | $25,525 |
| 2015 | $1,115 | $28,975 | $3,450 | $25,525 |
| 2014 | $1,043 | $28,975 | $3,450 | $25,525 |
Source: Public Records
Map
Nearby Homes
- 1007 Spring St
- 102 W Locust St
- 112 W Chestnut St
- 203 E Locust St
- 102 E Walnut St
- 403 W Poplar St
- 900 Grover St
- 116 Tipton St Unit 209
- 414 S Roan St Unit 202
- 300 Peach Blossom Ct
- 200 E Main St Unit 5
- 433 W Poplar St
- 908 Afton St
- 106 Water St
- 707 W Maple St
- 302 Wilson Ave
- 805 E Maple St
- 1503 Virginia St
- 1125 Cedar Place
- 116 E Unaka Ave
- 114 W Locust St
- 112 W Locust St
- 200 W Locust St
- 1004 Spring St
- 1004 Spring St Unit 1
- 110 W Locust St
- 115 W Pine St
- 115 W Pine St
- 119 W Pine St
- 117 W Pine St Unit 117
- 202 W Locust St
- 119 W Locust St
- 115 W Locust St
- 113 W Locust St
- 111 W Pine St
- 204 W Locust St
- 201 W Locust St
- 111 W Locust St
- 109 W Pine St
- 109 W Pine St Unit 1/2