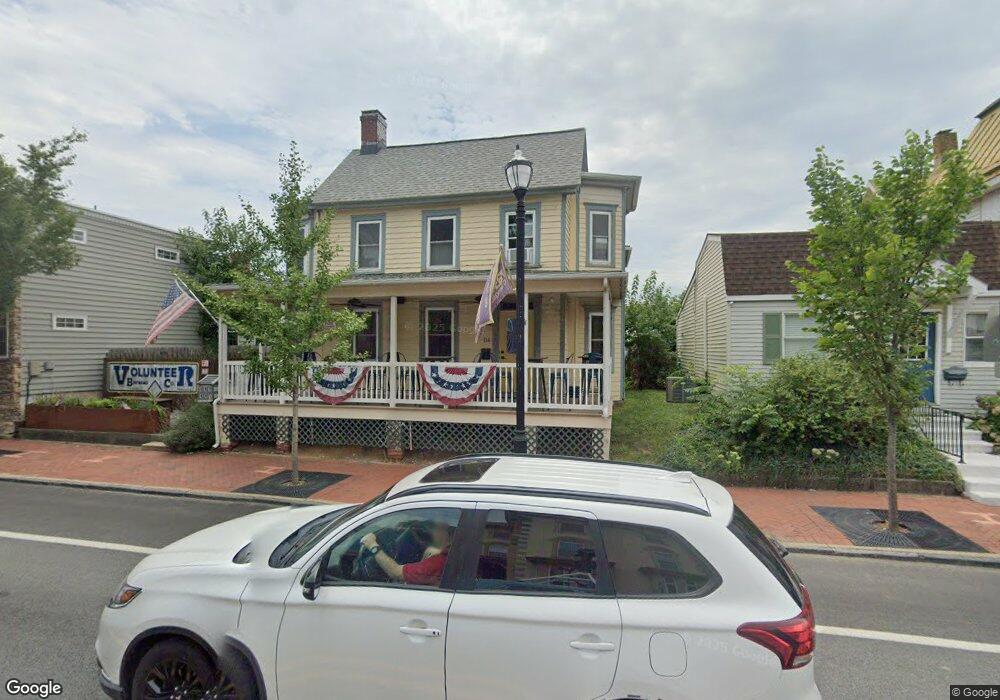
116 W Main St Middletown, DE 19709
Estimated Value: $316,000 - $444,074
2
Beds
2
Baths
1,725
Sq Ft
$226/Sq Ft
Est. Value
About This Home
This home is located at 116 W Main St, Middletown, DE 19709 and is currently estimated at $389,269, approximately $225 per square foot. 116 W Main St is a home located in New Castle County with nearby schools including Silver Lake Elementary School, Everett Meredith Middle School, and Middletown High School.
Ownership History
Date
Name
Owned For
Owner Type
Purchase Details
Closed on
Oct 25, 2018
Sold by
Pickett John E and Pickett Tammy L
Bought by
Triple Twelve Llc
Current Estimated Value
Home Financials for this Owner
Home Financials are based on the most recent Mortgage that was taken out on this home.
Original Mortgage
$229,500
Outstanding Balance
$200,156
Interest Rate
4.6%
Mortgage Type
New Conventional
Estimated Equity
$189,113
Purchase Details
Closed on
Dec 13, 2001
Sold by
Pickett John E
Bought by
Pickett John E and Pickett Tammy L
Create a Home Valuation Report for This Property
The Home Valuation Report is an in-depth analysis detailing your home's value as well as a comparison with similar homes in the area
Home Values in the Area
Average Home Value in this Area
Purchase History
| Date | Buyer | Sale Price | Title Company |
|---|---|---|---|
| Triple Twelve Llc | $280,000 | None Available | |
| Pickett John E | -- | -- |
Source: Public Records
Mortgage History
| Date | Status | Borrower | Loan Amount |
|---|---|---|---|
| Open | Triple Twelve Llc | $229,500 |
Source: Public Records
Tax History
| Year | Tax Paid | Tax Assessment Tax Assessment Total Assessment is a certain percentage of the fair market value that is determined by local assessors to be the total taxable value of land and additions on the property. | Land | Improvement |
|---|---|---|---|---|
| 2024 | $117 | $38,900 | $5,300 | $33,600 |
| 2023 | $117 | $38,900 | $5,300 | $33,600 |
| 2022 | $1,196 | $38,900 | $5,300 | $33,600 |
| 2021 | $1,170 | $38,900 | $5,300 | $33,600 |
| 2020 | $1,156 | $38,900 | $5,300 | $33,600 |
| 2019 | $1,188 | $38,900 | $5,300 | $33,600 |
| 2018 | $1,025 | $38,900 | $5,300 | $33,600 |
| 2017 | $0 | $38,900 | $5,300 | $33,600 |
| 2016 | -- | $38,900 | $5,300 | $33,600 |
| 2015 | -- | $38,900 | $5,300 | $33,600 |
| 2014 | $855 | $38,900 | $5,300 | $33,600 |
Source: Public Records
Map
Nearby Homes
- 102 S Broad St
- 14 W Lake St
- 11 W Hoffecker St
- 12 E Cochran St
- 11 E Lockwood St
- 129 E Main St
- 113 Crawford St
- 108 E Cochran St
- 102 E Redding St
- 8 Redding Cir
- 3 Redding Cir
- 25 Franklin Dr
- 610 Louis Ln
- 659 Warren Dr
- 541 Diamond Dr
- 162 Liborio Dr
- 403 New St
- 60 S Cummings Dr
- 908 S Cass St
- 40 S Cummings Dr
Your Personal Tour Guide
Ask me questions while you tour the home.