Estimated Value: $131,557 - $141,000
2
Beds
1
Bath
864
Sq Ft
$158/Sq Ft
Est. Value
About This Home
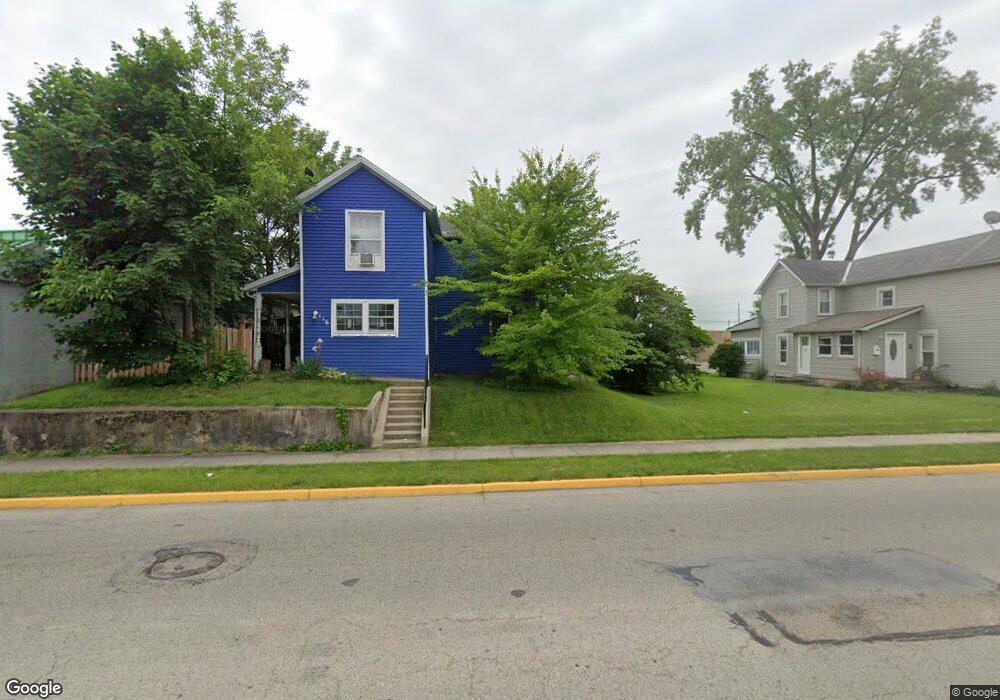
This home is located at 116 W Market St, Troy, OH 45373 and is currently estimated at $136,889, approximately $158 per square foot. 116 W Market St is a home located in Miami County with nearby schools including Kyle Elementary School, Van Cleve Elementary School, and Troy Junior High School.
Ownership History
Date
Name
Owned For
Owner Type
Purchase Details
Closed on
Jun 22, 2015
Sold by
Security Lending Ltd
Bought by
Aguimiga Garnica Maria
Current Estimated Value
Purchase Details
Closed on
Feb 28, 2013
Sold by
Steinke Chris J and Steinke Della M
Bought by
Security Lending Ltd
Purchase Details
Closed on
Nov 18, 2003
Sold by
Barton Leslie W and Barton Rosamond Y
Bought by
Steinke Chris J and Steinke Della M
Purchase Details
Closed on
Jun 1, 1988
Bought by
Barton Leslie W
Create a Home Valuation Report for This Property
The Home Valuation Report is an in-depth analysis detailing your home's value as well as a comparison with similar homes in the area
Home Values in the Area
Average Home Value in this Area
Purchase History
| Date | Buyer | Sale Price | Title Company |
|---|---|---|---|
| Aguimiga Garnica Maria | $20,000 | Attorney | |
| Security Lending Ltd | -- | Attorney | |
| Steinke Chris J | $90,000 | -- | |
| Barton Leslie W | $30,000 | -- |
Source: Public Records
Mortgage History
| Date | Status | Borrower | Loan Amount |
|---|---|---|---|
| Closed | Steinke Chris J | $0 |
Source: Public Records
Tax History Compared to Growth
Tax History
| Year | Tax Paid | Tax Assessment Tax Assessment Total Assessment is a certain percentage of the fair market value that is determined by local assessors to be the total taxable value of land and additions on the property. | Land | Improvement |
|---|---|---|---|---|
| 2024 | $1,399 | $29,580 | $9,590 | $19,990 |
| 2023 | $1,399 | $29,580 | $9,590 | $19,990 |
| 2022 | $1,073 | $29,580 | $9,590 | $19,990 |
| 2021 | $926 | $23,670 | $7,670 | $16,000 |
| 2020 | $927 | $23,670 | $7,670 | $16,000 |
| 2019 | $935 | $23,670 | $7,670 | $16,000 |
| 2018 | $824 | $19,600 | $7,280 | $12,320 |
| 2017 | $831 | $19,600 | $7,280 | $12,320 |
| 2016 | $962 | $19,600 | $7,280 | $12,320 |
| 2015 | $910 | $20,660 | $7,670 | $12,990 |
| 2014 | $910 | $20,660 | $7,670 | $12,990 |
| 2013 | $915 | $20,660 | $7,670 | $12,990 |
Source: Public Records
Map
Nearby Homes
- 309 W Market St
- 727 Grant St
- 804 S Walnut St
- 517 W Market St
- 512 Peters Ave
- 345 W Ross St
- 814 S Clay St
- 385 W Ross St
- 408 S Market St
- 502 Lincoln Ave
- 808 S Crawford St
- 917 S Clay St
- 609 Old Newton Pike
- 318 S Mulberry St
- 410 W Race St
- 1002 S Market St
- 530 Pennsylvania Ave
- 339 Lincoln Ave
- 28 W Canal St
- 100 W Market St
- 126 W Market St
- 127 W Market St Unit D
- 190 W Market St
- 190 Peters Ave
- 202 W Market St
- 209 Peters Ave
- 1007 Lincoln Ave
- 208 W Market St
- 0 Peterson Rd
- 44 Peters Ave
- 1003 Lincoln Ave
- 217 Peters Ave
- 218 W Market St
- 1010 Lincoln Ave
- 225 W Market St
- 29 W Market St
- 1004 Lincoln Ave
- 222 W Market St
- 917 Garfield Ave