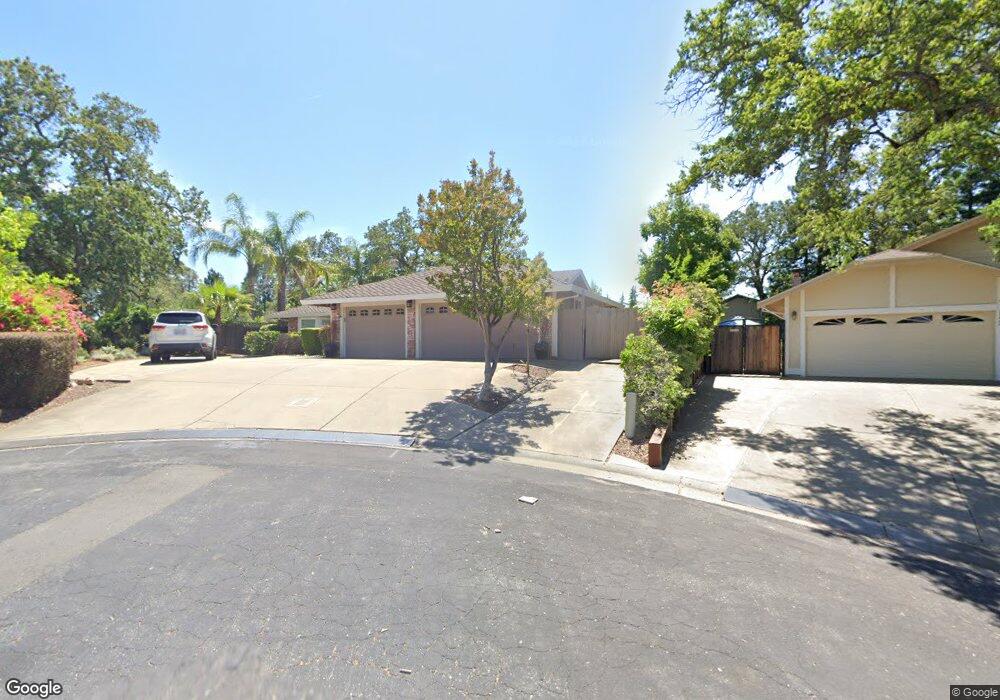
116 Wilson Ct Folsom, CA 95630
Briggs Ranch NeighborhoodEstimated Value: $706,000 - $738,000
4
Beds
2
Baths
1,983
Sq Ft
$365/Sq Ft
Est. Value
About This Home
This home is located at 116 Wilson Ct, Folsom, CA 95630 and is currently estimated at $723,807, approximately $365 per square foot. 116 Wilson Ct is a home located in Sacramento County with nearby schools including Blanche Sprentz Elementary School, Sutter Middle School, and St. John Notre Dame.
Ownership History
Date
Name
Owned For
Owner Type
Purchase Details
Closed on
Nov 19, 2025
Sold by
Ricardo L Pulido L and Ricardo Carmen G
Bought by
Steven And Shelby Pulido Living Trust and Pulido
Current Estimated Value
Purchase Details
Closed on
Sep 16, 2004
Sold by
Pulido Ricardo and Pulido Carmen
Bought by
Pulido Ricardo L and Pulido Carmen G
Home Financials for this Owner
Home Financials are based on the most recent Mortgage that was taken out on this home.
Original Mortgage
$100,000
Interest Rate
5.95%
Mortgage Type
Purchase Money Mortgage
Purchase Details
Closed on
Aug 12, 2004
Sold by
Ile Vasile and Ile Florika
Bought by
Pulido Ricardo and Pulido Carmen
Home Financials for this Owner
Home Financials are based on the most recent Mortgage that was taken out on this home.
Original Mortgage
$100,000
Interest Rate
5.95%
Mortgage Type
Purchase Money Mortgage
Purchase Details
Closed on
Apr 23, 2003
Sold by
Sobhani Saeedeh
Bought by
Ile Vasile and Ile Florika
Home Financials for this Owner
Home Financials are based on the most recent Mortgage that was taken out on this home.
Original Mortgage
$50,000
Interest Rate
5.72%
Create a Home Valuation Report for This Property
The Home Valuation Report is an in-depth analysis detailing your home's value as well as a comparison with similar homes in the area
Home Values in the Area
Average Home Value in this Area
Purchase History
| Date | Buyer | Sale Price | Title Company |
|---|---|---|---|
| Steven And Shelby Pulido Living Trust | -- | None Listed On Document | |
| Pulido Ricardo L | -- | -- | |
| Pulido Ricardo | $480,000 | North American Title Co | |
| Ile Vasile | $360,000 | North American Title Co |
Source: Public Records
Mortgage History
| Date | Status | Borrower | Loan Amount |
|---|---|---|---|
| Previous Owner | Pulido Ricardo | $100,000 | |
| Previous Owner | Ile Vasile | $50,000 | |
| Closed | Ile Vasile | $75,000 |
Source: Public Records
Tax History
| Year | Tax Paid | Tax Assessment Tax Assessment Total Assessment is a certain percentage of the fair market value that is determined by local assessors to be the total taxable value of land and additions on the property. | Land | Improvement |
|---|---|---|---|---|
| 2025 | $7,147 | $669,057 | $137,987 | $531,070 |
| 2024 | $7,147 | $655,939 | $135,282 | $520,657 |
| 2023 | $6,944 | $643,079 | $132,630 | $510,449 |
| 2022 | $6,841 | $630,471 | $130,030 | $500,441 |
| 2021 | $6,749 | $618,110 | $127,481 | $490,629 |
| 2020 | $6,665 | $611,773 | $126,174 | $485,599 |
| 2019 | $6,553 | $599,778 | $123,700 | $476,078 |
| 2018 | $6,388 | $588,019 | $121,275 | $466,744 |
| 2017 | $5,648 | $547,021 | $112,820 | $434,201 |
| 2016 | $5,621 | $511,236 | $105,440 | $405,796 |
| 2015 | $5,300 | $491,574 | $101,385 | $390,189 |
| 2014 | $5,029 | $481,935 | $99,397 | $382,538 |
Source: Public Records
Map
Nearby Homes
- 115 Winchester Ct
- 205 Briarcliff Dr
- 260 Flower Dr
- 101 Kerr Ct
- 100 Boxler Ct
- 124 Windstar Cir
- 110 Fargo Way
- 617 Wales Dr
- 1121 Elderberry Cir
- 409 Wales Dr
- 0 Figueroa St Unit 225034113
- 167 Price Way
- 102 Black Gold Ln
- 1054 Ledgestone Dr
- 182 Price Way
- 98-98 1/2 Dean Way
- 1425 Humbug Creek Dr
- 757 Hatherden Ct
- 101 Duxbury Way
- 219 Needles Way
- 113 Wilson Ct
- 119 Thomas Ct
- 118 Thomas Ct
- 112 Wilson Ct
- 109 Wilson Ct
- 108 Wilson Ct
- 115 Thomas Ct
- 108 Echo Ct
- 114 Thomas Ct
- 404 Willow Creek Dr
- 408 Willow Creek Dr
- 400 Willow Creek Dr
- 104 Echo Ct
- 121 Johnston Ct
- 105 Wilson Ct
- 412 Willow Creek Dr
- 104 Wilson Ct
- 117 Johnston Ct
- 107 Echo Ct
- 110 Thomas Ct
Your Personal Tour Guide
Ask me questions while you tour the home.