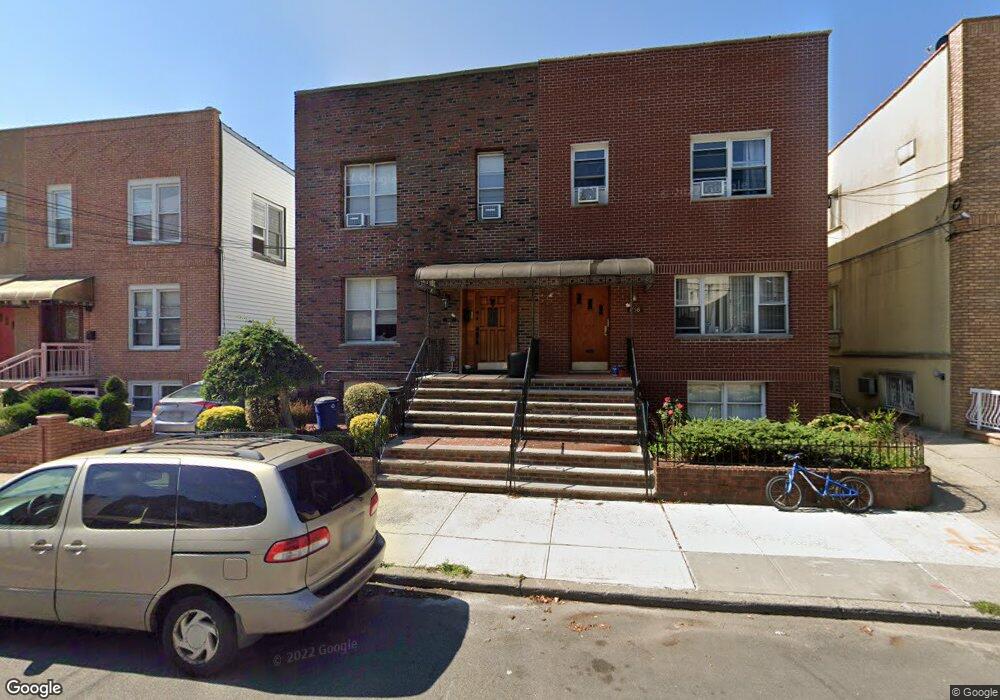
1160 71st St Brooklyn, NY 11228
Dyker Heights NeighborhoodEstimated Value: $1,693,000 - $1,935,000
--
Bed
--
Bath
3,480
Sq Ft
$522/Sq Ft
Est. Value
About This Home
This home is located at 1160 71st St, Brooklyn, NY 11228 and is currently estimated at $1,818,000, approximately $522 per square foot. 1160 71st St is a home located in Kings County with nearby schools including P.S. 176 Ovington, IS 201 Madeleine Brennan Intermediate School, and New Utrecht High School.
Ownership History
Date
Name
Owned For
Owner Type
Purchase Details
Closed on
Dec 10, 2018
Sold by
Cafarella Rosalie and Cafarella Rosalie M
Bought by
Cafarella Rosalie M and Cafarella Thomas J
Current Estimated Value
Home Financials for this Owner
Home Financials are based on the most recent Mortgage that was taken out on this home.
Original Mortgage
$1,019,475
Outstanding Balance
$899,972
Interest Rate
4.9%
Mortgage Type
Unknown
Estimated Equity
$918,028
Purchase Details
Closed on
Mar 27, 2002
Sold by
Dickinson Mary Ann and Cafarella Rosalie
Bought by
Cafarella Rosalle
Create a Home Valuation Report for This Property
The Home Valuation Report is an in-depth analysis detailing your home's value as well as a comparison with similar homes in the area
Home Values in the Area
Average Home Value in this Area
Purchase History
| Date | Buyer | Sale Price | Title Company |
|---|---|---|---|
| Cafarella Rosalie M | -- | -- | |
| Cafarella Rosalle | -- | -- |
Source: Public Records
Mortgage History
| Date | Status | Borrower | Loan Amount |
|---|---|---|---|
| Open | Cafarella Rosalie M | $1,019,475 | |
| Closed | Cafarella Rosalie M | $1,019,475 |
Source: Public Records
Tax History Compared to Growth
Tax History
| Year | Tax Paid | Tax Assessment Tax Assessment Total Assessment is a certain percentage of the fair market value that is determined by local assessors to be the total taxable value of land and additions on the property. | Land | Improvement |
|---|---|---|---|---|
| 2025 | $11,831 | $102,300 | $25,860 | $76,440 |
| 2024 | $11,831 | $103,680 | $25,860 | $77,820 |
| 2023 | $11,352 | $105,960 | $25,860 | $80,100 |
| 2022 | $11,158 | $103,740 | $25,860 | $77,880 |
| 2021 | $11,603 | $97,200 | $25,860 | $71,340 |
| 2020 | $8,702 | $91,140 | $25,860 | $65,280 |
| 2019 | $10,268 | $84,480 | $25,860 | $58,620 |
| 2018 | $9,495 | $46,579 | $15,301 | $31,278 |
| 2017 | $9,495 | $46,579 | $17,321 | $29,258 |
| 2016 | $9,185 | $45,944 | $21,784 | $24,160 |
| 2015 | $5,080 | $43,344 | $20,415 | $22,929 |
| 2014 | $5,080 | $40,905 | $16,369 | $24,536 |
Source: Public Records
Map
Nearby Homes