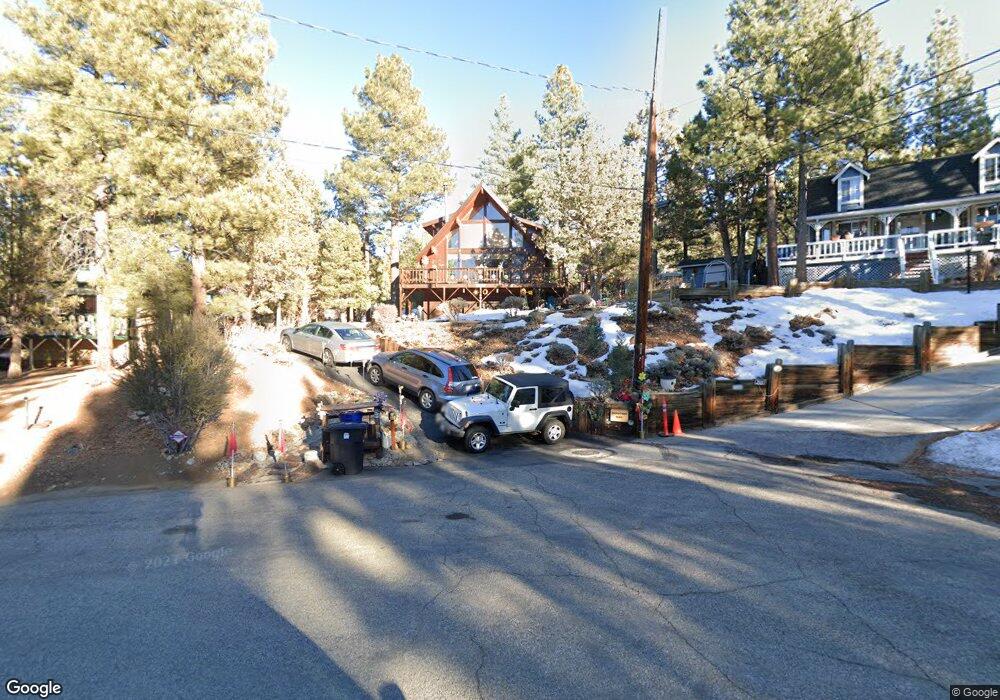
1160 Ash Ln Big Bear City, CA 92314
Estimated Value: $379,000 - $451,000
2
Beds
2
Baths
1,240
Sq Ft
$324/Sq Ft
Est. Value
About This Home
This home is located at 1160 Ash Ln, Big Bear City, CA 92314 and is currently estimated at $402,358, approximately $324 per square foot. 1160 Ash Ln is a home located in San Bernardino County with nearby schools including Baldwin Lane Elementary School, Big Bear Middle School, and Big Bear High School.
Ownership History
Date
Name
Owned For
Owner Type
Purchase Details
Closed on
Jun 6, 1996
Sold by
Meyer Christina R
Bought by
Harris Seoud Moustafa T and Harris Seoud Patricia
Current Estimated Value
Home Financials for this Owner
Home Financials are based on the most recent Mortgage that was taken out on this home.
Original Mortgage
$120,000
Outstanding Balance
$7,674
Interest Rate
8.01%
Estimated Equity
$394,684
Purchase Details
Closed on
Apr 3, 1996
Sold by
Meyer Christina R
Bought by
Meyer Christina R
Create a Home Valuation Report for This Property
The Home Valuation Report is an in-depth analysis detailing your home's value as well as a comparison with similar homes in the area
Home Values in the Area
Average Home Value in this Area
Purchase History
| Date | Buyer | Sale Price | Title Company |
|---|---|---|---|
| Harris Seoud Moustafa T | $140,000 | First American Title Ins Co | |
| Meyer Christina R | -- | -- |
Source: Public Records
Mortgage History
| Date | Status | Borrower | Loan Amount |
|---|---|---|---|
| Open | Harris Seoud Moustafa T | $120,000 |
Source: Public Records
Tax History Compared to Growth
Tax History
| Year | Tax Paid | Tax Assessment Tax Assessment Total Assessment is a certain percentage of the fair market value that is determined by local assessors to be the total taxable value of land and additions on the property. | Land | Improvement |
|---|---|---|---|---|
| 2025 | $3,450 | $228,022 | $57,005 | $171,017 |
| 2024 | $3,450 | $223,551 | $55,887 | $167,664 |
| 2023 | $3,345 | $219,167 | $54,791 | $164,376 |
| 2022 | $3,219 | $214,870 | $53,717 | $161,153 |
| 2021 | $3,149 | $210,657 | $52,664 | $157,993 |
| 2020 | $3,159 | $208,497 | $52,124 | $156,373 |
| 2019 | $3,111 | $204,409 | $51,102 | $153,307 |
| 2018 | $2,994 | $200,401 | $50,100 | $150,301 |
| 2017 | $2,913 | $196,472 | $49,118 | $147,354 |
| 2016 | $2,840 | $192,620 | $48,155 | $144,465 |
| 2015 | $2,798 | $189,727 | $47,432 | $142,295 |
| 2014 | $2,741 | $186,011 | $46,503 | $139,508 |
Source: Public Records
Map
Nearby Homes