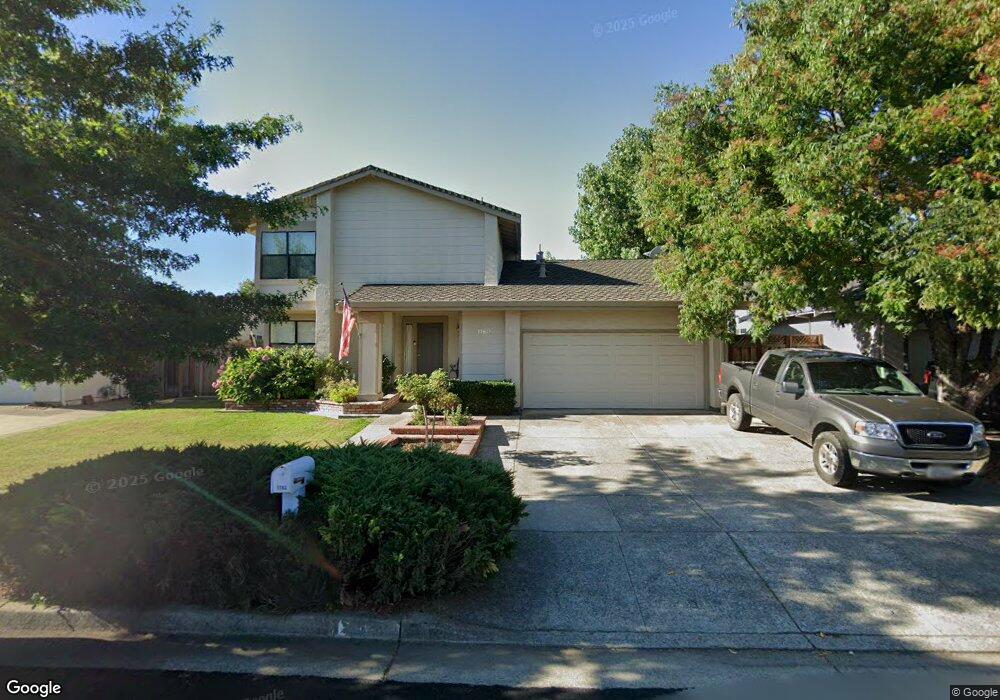
1160 Hersman Dr Gilroy, CA 95020
Estimated Value: $954,000 - $1,136,000
4
Beds
3
Baths
2,229
Sq Ft
$470/Sq Ft
Est. Value
About This Home
This home is located at 1160 Hersman Dr, Gilroy, CA 95020 and is currently estimated at $1,046,542, approximately $469 per square foot. 1160 Hersman Dr is a home located in Santa Clara County with nearby schools including El Roble Elementary School, Brownell Middle School, and Solorsano Middle School.
Ownership History
Date
Name
Owned For
Owner Type
Purchase Details
Closed on
Jun 3, 2020
Sold by
Yinger Patricia and Herbner Patricia
Bought by
Yinger Patricia and The Patricia Yinger Living Tru
Current Estimated Value
Purchase Details
Closed on
Nov 7, 2001
Sold by
Herbner John
Bought by
Herbner John and Herbner Patricia
Home Financials for this Owner
Home Financials are based on the most recent Mortgage that was taken out on this home.
Original Mortgage
$203,000
Outstanding Balance
$78,757
Interest Rate
6.62%
Estimated Equity
$967,785
Purchase Details
Closed on
Jan 14, 1997
Sold by
Yinger Patricia
Bought by
Herbner John
Home Financials for this Owner
Home Financials are based on the most recent Mortgage that was taken out on this home.
Original Mortgage
$165,000
Interest Rate
7.5%
Purchase Details
Closed on
May 21, 1996
Sold by
Noble William R and Noble Elizabeth S
Bought by
Federal Home Loan Mortgage Corporation
Create a Home Valuation Report for This Property
The Home Valuation Report is an in-depth analysis detailing your home's value as well as a comparison with similar homes in the area
Home Values in the Area
Average Home Value in this Area
Purchase History
| Date | Buyer | Sale Price | Title Company |
|---|---|---|---|
| Yinger Patricia | -- | None Available | |
| Herbner John | -- | Fidelity National Title Co | |
| Herbner John | -- | North American Title Co | |
| Herbner John | $245,500 | North American Title Co | |
| Federal Home Loan Mortgage Corporation | $205,000 | Stewart Title |
Source: Public Records
Mortgage History
| Date | Status | Borrower | Loan Amount |
|---|---|---|---|
| Open | Herbner John | $203,000 | |
| Closed | Herbner John | $165,000 |
Source: Public Records
Tax History
| Year | Tax Paid | Tax Assessment Tax Assessment Total Assessment is a certain percentage of the fair market value that is determined by local assessors to be the total taxable value of land and additions on the property. | Land | Improvement |
|---|---|---|---|---|
| 2025 | $4,849 | $399,817 | $105,850 | $293,967 |
| 2024 | $4,849 | $391,978 | $103,775 | $288,203 |
| 2023 | $4,819 | $384,293 | $101,741 | $282,552 |
| 2022 | $4,737 | $376,759 | $99,747 | $277,012 |
| 2021 | $4,713 | $369,373 | $97,792 | $271,581 |
| 2020 | $4,661 | $365,587 | $96,790 | $268,797 |
| 2019 | $4,616 | $358,420 | $94,893 | $263,527 |
| 2018 | $4,312 | $351,393 | $93,033 | $258,360 |
| 2017 | $4,399 | $344,504 | $91,209 | $253,295 |
| 2016 | $4,305 | $337,750 | $89,421 | $248,329 |
| 2015 | $4,062 | $332,677 | $88,078 | $244,599 |
| 2014 | $4,035 | $326,161 | $86,353 | $239,808 |
Source: Public Records
Map
Nearby Homes
- 7609 Santa Paula Dr
- 1250 Driftwood Terrace
- 925 Blake Ct
- 1330 Redwood Ln
- 7490 Santa Theresa Dr Unit 10
- 6389 Tawhana Ln
- 1231 Juniper Dr Unit H
- 7460 Miller Ave
- 7440 Carnoustie Ct
- 7902 English Oak Cir
- 7821 Santa Theresa Dr
- 7942 English Oak Cir
- 60 Monte Vista Way
- 1826 Club Dr
- 704 Tennyson Dr
- 7305 Orchard Dr
- 7100 Potomac Place
- 7384 Ailes Ct
- 8170 Westwood Dr Unit 22
- 700 Eschenburg Dr
- 1170 Hersman Dr
- 1150 Hersman Dr
- 1180 Hersman Dr
- 1140 Hersman Dr
- 1161 Hersman Dr
- 1171 Hersman Dr
- 1190 Hersman Dr
- 7508 Stewart Dr Unit 11
- 1181 Hersman Dr
- 7510 Stewart Dr
- 1191 Hersman Dr
- 1200 Hersman Dr
- 7501 Crawford Dr
- 1201 Hersman Dr
- 1140 Ayer Dr
- 1160 Ayer Dr
- 7509 Santa Paula Dr
- 1170 Ayer Dr
- 1130 Ayer Dr
- 1211 Hersman Dr
Your Personal Tour Guide
Ask me questions while you tour the home.