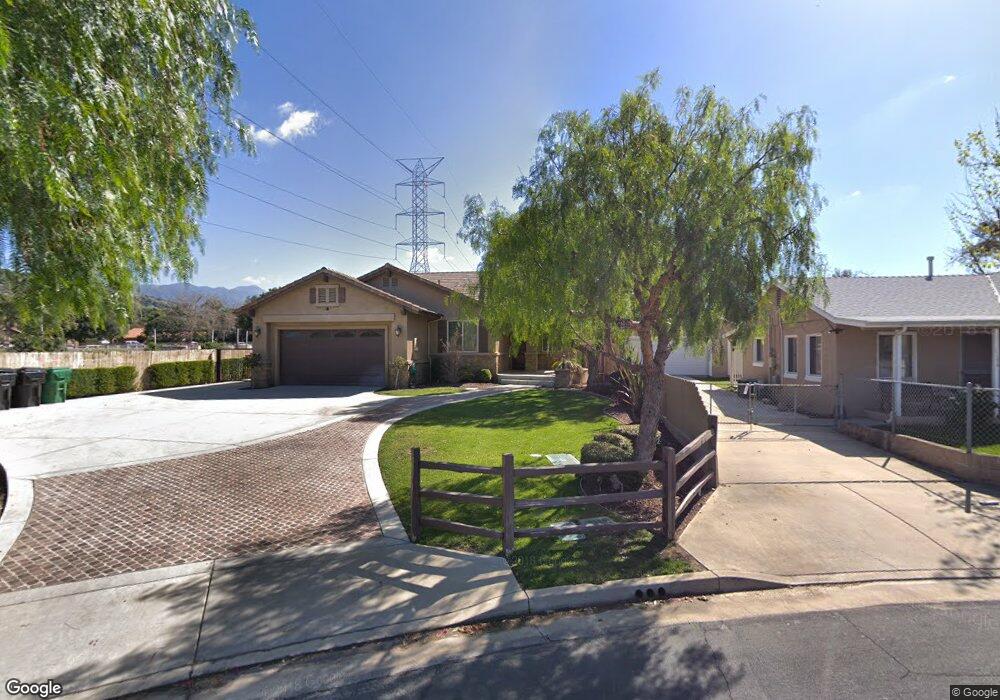
1160 N Iglesia St Unit 1/2 San Dimas, CA 91773
Estimated Value: $1,464,000 - $2,129,848
1
Bed
1
Bath
3,903
Sq Ft
$447/Sq Ft
Est. Value
About This Home
This home is located at 1160 N Iglesia St Unit 1/2, San Dimas, CA 91773 and is currently estimated at $1,743,462, approximately $446 per square foot. 1160 N Iglesia St Unit 1/2 is a home located in Los Angeles County with nearby schools including Arma J. Shull Elementary School, Lone Hill Middle School, and San Dimas High School.
Ownership History
Date
Name
Owned For
Owner Type
Purchase Details
Closed on
Jun 26, 2025
Sold by
Coolman Scott
Bought by
Scott And Kirsten Coolman Family Trust and Coolman
Current Estimated Value
Purchase Details
Closed on
Dec 23, 2012
Sold by
Laplaca Gaetano and Laplaca La Placa
Bought by
Coolman Scott
Home Financials for this Owner
Home Financials are based on the most recent Mortgage that was taken out on this home.
Original Mortgage
$400,000
Interest Rate
3.27%
Mortgage Type
New Conventional
Purchase Details
Closed on
Apr 28, 2008
Sold by
La Placa Construction Inc
Bought by
Laplaca Gaetano and Laplaca La Placa
Purchase Details
Closed on
Sep 21, 2004
Sold by
G Apex Llc
Bought by
La Placa Construction Inc
Purchase Details
Closed on
Dec 23, 2003
Sold by
Stankov Oscar
Bought by
G-Apex Llc
Purchase Details
Closed on
Aug 27, 2003
Sold by
Stankov Steve and Stankov Oscar
Bought by
Stankov Oscar
Create a Home Valuation Report for This Property
The Home Valuation Report is an in-depth analysis detailing your home's value as well as a comparison with similar homes in the area
Home Values in the Area
Average Home Value in this Area
Purchase History
| Date | Buyer | Sale Price | Title Company |
|---|---|---|---|
| Scott And Kirsten Coolman Family Trust | -- | None Listed On Document | |
| Coolman Scott | $780,000 | Equity Title Company | |
| Laplaca Gaetano | $405,000 | Accommodation | |
| La Placa Construction Inc | -- | Southland Title | |
| G-Apex Llc | -- | Southland Title | |
| Stankov Oscar | -- | -- |
Source: Public Records
Mortgage History
| Date | Status | Borrower | Loan Amount |
|---|---|---|---|
| Previous Owner | Coolman Scott | $400,000 |
Source: Public Records
Tax History Compared to Growth
Tax History
| Year | Tax Paid | Tax Assessment Tax Assessment Total Assessment is a certain percentage of the fair market value that is determined by local assessors to be the total taxable value of land and additions on the property. | Land | Improvement |
|---|---|---|---|---|
| 2025 | $18,790 | $1,575,253 | $492,568 | $1,082,685 |
| 2024 | $18,790 | $1,544,366 | $482,910 | $1,061,456 |
| 2023 | $18,382 | $1,514,086 | $473,442 | $1,040,644 |
| 2022 | $13,975 | $1,114,840 | $464,159 | $650,681 |
| 2021 | $13,717 | $1,092,981 | $455,058 | $637,923 |
| 2020 | $13,530 | $1,081,774 | $450,392 | $631,382 |
| 2019 | $13,333 | $1,060,563 | $441,561 | $619,002 |
| 2018 | $12,246 | $1,037,297 | $432,903 | $604,394 |
| 2016 | $11,098 | $934,654 | $416,094 | $518,560 |
| 2015 | $10,917 | $920,615 | $409,844 | $510,771 |
| 2014 | $9,725 | $804,541 | $401,816 | $402,725 |
Source: Public Records
Map
Nearby Homes
- 1136 Cherokee Ct
- 237 Maverick Dr
- 555 Canyon Hill Rd
- 1287 Whisperglen Ln
- 833 N Oceanbluff Ave
- 953 Alleghany Cir
- 1255 Bonnie Glen Ln
- 411 Heatherglen Ln
- 629 Calaveras Rd
- 750 N Northcape Ave
- 562 E Allen Ave
- 2556 Charford St
- 1302 Sierra View Dr
- 612 N Oceanbluff Ave
- 0 Dallas Rd Unit WS25141209
- 4575 Ramona Ave Unit 16
- 4545 Ramona Ave Unit 9
- 4565 Ramona Ave Unit 4
- 827 Deerflats Dr
- 422 E Payson St
- 1160 N Iglesia St
- 264 E Foothill Blvd
- 1148 N Iglesia St
- 1154 N Iglesia St
- 1140 N Iglesia St
- 1136 N Iglesia St
- 142 E Oberg St
- 1151 N Walnut Ave
- 224 Rodeo Ct
- 145 E Penn St
- 1300 Longhorn Dr
- 216 Rodeo Ct
- 136 E Oberg St
- 1145 N Walnut Ave
- 1130 N Iglesia St
- 1200 N Walnut Ave
- 139 E Penn St
- 132 E Oberg St
- 1154 N Walnut Ave
- 1139 N Walnut Ave