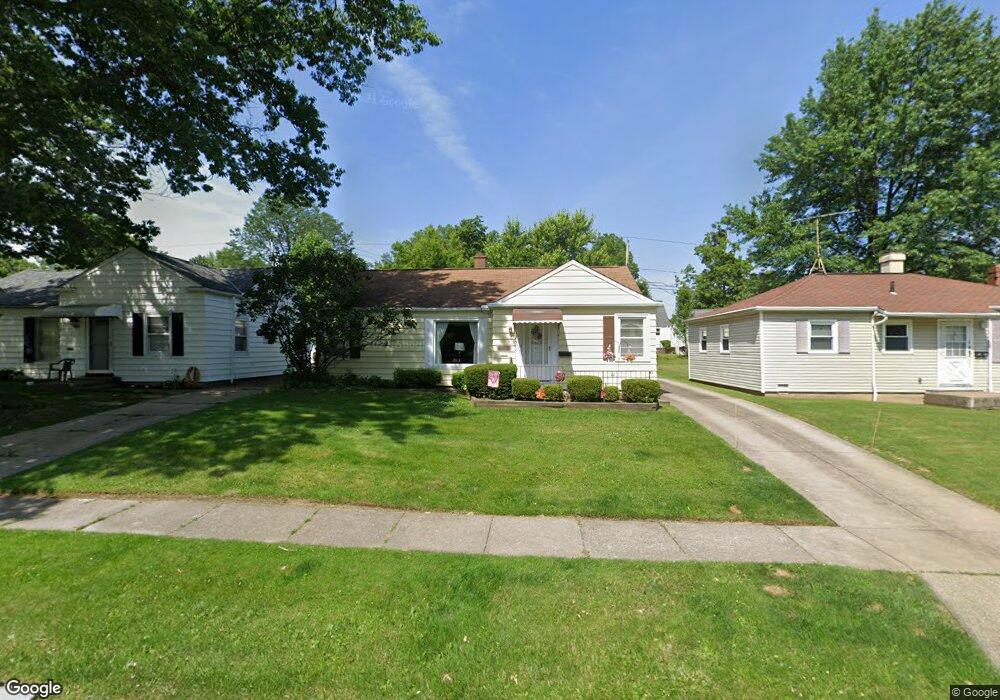
1160 Orchard Heights Dr Cleveland, OH 44124
Estimated Value: $170,000 - $202,000
3
Beds
1
Bath
980
Sq Ft
$190/Sq Ft
Est. Value
About This Home
This home is located at 1160 Orchard Heights Dr, Cleveland, OH 44124 and is currently estimated at $186,388, approximately $190 per square foot. 1160 Orchard Heights Dr is a home located in Cuyahoga County with nearby schools including Mayfield High School, Corpus Christi Academy, and Saint Paschal Baylon School.
Ownership History
Date
Name
Owned For
Owner Type
Purchase Details
Closed on
Jul 15, 2023
Sold by
Ursetti Carmen and Ursetti Roberta
Bought by
Obrien Karen E
Current Estimated Value
Home Financials for this Owner
Home Financials are based on the most recent Mortgage that was taken out on this home.
Original Mortgage
$80,000
Outstanding Balance
$78,049
Interest Rate
6.67%
Mortgage Type
New Conventional
Estimated Equity
$108,339
Purchase Details
Closed on
Jul 31, 2006
Sold by
Crotty Janice M
Bought by
Ursetti Carmen and Ursetti Roberta
Home Financials for this Owner
Home Financials are based on the most recent Mortgage that was taken out on this home.
Original Mortgage
$118,000
Interest Rate
6.82%
Mortgage Type
Purchase Money Mortgage
Purchase Details
Closed on
May 3, 2000
Sold by
Kriz Lucille M
Bought by
Kriz Lucille M and Crotty Janice M
Purchase Details
Closed on
Sep 7, 1990
Sold by
Kriz Joseph J and Kriz Lucille M
Bought by
Kriz Lucille M
Purchase Details
Closed on
Jan 1, 1984
Bought by
Kriz Joseph J and Kriz Lucille M
Create a Home Valuation Report for This Property
The Home Valuation Report is an in-depth analysis detailing your home's value as well as a comparison with similar homes in the area
Home Values in the Area
Average Home Value in this Area
Purchase History
| Date | Buyer | Sale Price | Title Company |
|---|---|---|---|
| Obrien Karen E | $172,000 | Black Tie Title | |
| Ursetti Carmen | $118,000 | Affinity | |
| Kriz Lucille M | -- | -- | |
| Kriz Lucille M | -- | -- | |
| Kriz Joseph J | -- | -- |
Source: Public Records
Mortgage History
| Date | Status | Borrower | Loan Amount |
|---|---|---|---|
| Open | Obrien Karen E | $80,000 | |
| Previous Owner | Ursetti Carmen | $118,000 |
Source: Public Records
Tax History Compared to Growth
Tax History
| Year | Tax Paid | Tax Assessment Tax Assessment Total Assessment is a certain percentage of the fair market value that is determined by local assessors to be the total taxable value of land and additions on the property. | Land | Improvement |
|---|---|---|---|---|
| 2024 | $3,303 | $50,050 | $10,920 | $39,130 |
| 2023 | $3,004 | $42,250 | $9,940 | $32,310 |
| 2022 | $3,110 | $42,245 | $9,940 | $32,305 |
| 2021 | $3,078 | $42,250 | $9,940 | $32,310 |
| 2020 | $2,875 | $36,120 | $8,510 | $27,620 |
| 2019 | $2,786 | $103,200 | $24,300 | $78,900 |
| 2018 | $2,574 | $36,120 | $8,510 | $27,620 |
| 2017 | $2,607 | $31,710 | $7,490 | $24,220 |
| 2016 | $2,587 | $31,710 | $7,490 | $24,220 |
| 2015 | $2,869 | $31,710 | $7,490 | $24,220 |
| 2014 | $2,869 | $38,360 | $7,490 | $30,870 |
Source: Public Records
Map
Nearby Homes
- 1173 Commonwealth Ave
- 6248 S Woodlane Dr
- 1226 Genesee Ave
- 6205 S Woodlane Dr
- 1111 E Miner Rd
- 1297 E Miner Rd
- 1336 Genesee Ave
- 1296 Bonnie Ln
- 0 Maplewood Rd
- 6145 Hemingway Rd
- 1400 Orchard Heights Dr
- 1355 Washington Blvd
- 1402 Golden Gate Blvd Unit G102
- 5965 Ridgebury Blvd
- 1187 Cordova Rd
- 1379 Lander Rd
- 1193 Mayfield Ridge Rd
- 1337 Elmwood Rd
- 1062 Belwood Dr
- 874 Lander Rd
- 1166 Orchard Heights Dr
- 1156 Orchard Heights Dr
- 1172 Orchard Heights Dr
- 1163 Worton Blvd
- 1157 Worton Blvd
- 1167 Worton Blvd
- 1176 Orchard Heights Dr
- 1146 Orchard Heights Dr
- 1153 Worton Blvd
- 1171 Worton Blvd
- 1161 Worton Blvd
- 1161 Orchard Heights Dr
- 1167 Orchard Heights Dr
- 1157 Orchard Heights Dr
- 1147 Worton Blvd
- 1177 Worton Blvd
- 1180 Orchard Heights Dr
- 1140 Orchard Heights Dr
- 1171 Orchard Heights Dr
- 1151 Orchard Heights Dr