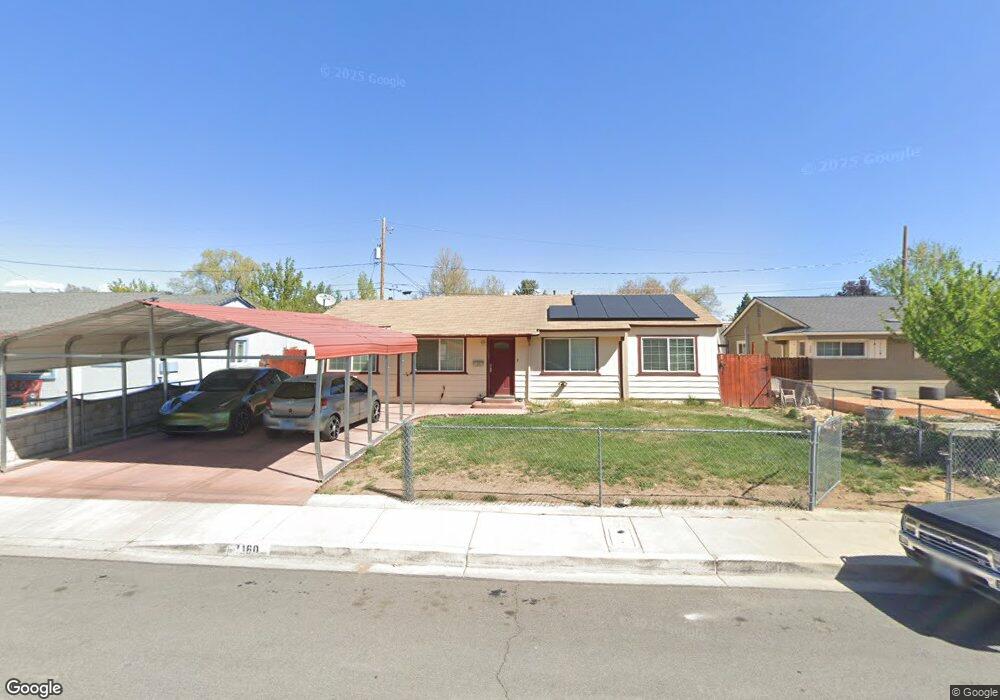
1160 Welling Way Sparks, NV 89431
North Rock NeighborhoodEstimated Value: $394,873 - $427,000
4
Beds
1
Bath
1,212
Sq Ft
$337/Sq Ft
Est. Value
About This Home
This home is located at 1160 Welling Way, Sparks, NV 89431 and is currently estimated at $408,468, approximately $337 per square foot. 1160 Welling Way is a home located in Washoe County with nearby schools including Alice Maxwell Elementary School, Sparks Middle School, and Sparks High School.
Ownership History
Date
Name
Owned For
Owner Type
Purchase Details
Closed on
Jan 25, 2011
Sold by
Welling Trust #1160 Nres Nv & 1 Llc
Bought by
Luna Eric
Current Estimated Value
Home Financials for this Owner
Home Financials are based on the most recent Mortgage that was taken out on this home.
Original Mortgage
$95,515
Outstanding Balance
$65,637
Interest Rate
4.87%
Mortgage Type
FHA
Estimated Equity
$342,831
Purchase Details
Closed on
Sep 23, 2010
Sold by
Capurro Tonya Raye
Bought by
Welling Trust #1160 and Nres Nv-1 Llc
Purchase Details
Closed on
Apr 30, 2001
Sold by
Kramer William
Bought by
Capurro Tonya Raye
Purchase Details
Closed on
Apr 16, 1999
Sold by
Capurro Kramer Jr William and Capurro Kramer Tonya
Bought by
Capurro Kramer Jr William and Capurro Kramer Tonya
Home Financials for this Owner
Home Financials are based on the most recent Mortgage that was taken out on this home.
Original Mortgage
$78,190
Interest Rate
7.1%
Create a Home Valuation Report for This Property
The Home Valuation Report is an in-depth analysis detailing your home's value as well as a comparison with similar homes in the area
Home Values in the Area
Average Home Value in this Area
Purchase History
| Date | Buyer | Sale Price | Title Company |
|---|---|---|---|
| Luna Eric | $98,000 | Western Title Company | |
| Welling Trust #1160 | $61,300 | Accommodation | |
| Capurro Tonya Raye | -- | -- | |
| Capurro Kramer Jr William | -- | United Title |
Source: Public Records
Mortgage History
| Date | Status | Borrower | Loan Amount |
|---|---|---|---|
| Open | Luna Eric | $95,515 | |
| Previous Owner | Capurro Kramer Jr William | $78,190 |
Source: Public Records
Tax History Compared to Growth
Tax History
| Year | Tax Paid | Tax Assessment Tax Assessment Total Assessment is a certain percentage of the fair market value that is determined by local assessors to be the total taxable value of land and additions on the property. | Land | Improvement |
|---|---|---|---|---|
| 2025 | $717 | $49,729 | $31,325 | $18,404 |
| 2024 | $717 | $48,281 | $30,100 | $18,181 |
| 2023 | $697 | $46,677 | $29,890 | $16,787 |
| 2022 | $677 | $38,715 | $25,095 | $13,620 |
| 2021 | $659 | $29,907 | $16,765 | $13,142 |
| 2020 | $637 | $29,412 | $16,345 | $13,067 |
| 2019 | $617 | $28,224 | $15,890 | $12,334 |
| 2018 | $600 | $23,083 | $11,235 | $11,848 |
| 2017 | $582 | $21,991 | $10,150 | $11,841 |
| 2016 | $568 | $20,093 | $8,225 | $11,868 |
| 2015 | $567 | $18,726 | $7,140 | $11,586 |
| 2014 | $553 | $17,383 | $6,440 | $10,943 |
| 2013 | -- | $14,637 | $3,955 | $10,682 |
Source: Public Records
Map
Nearby Homes
- 1110 Xman Way
- 1160 York Way
- 1345 Plymouth Way
- 1124 Sbragia Way
- 2154 Oppio St
- 1125 Dodson Way
- 1595 York Way
- 1003 Sbragia Way
- 1121 Greenbrae Dr
- 1655 Byrd Dr
- 1705 9th St
- 0 N Mccarran Blvd Unit 250052909
- 1365 Prospect Ave
- 1620 Gault Way
- 1799 Vance Way
- 1731 Gault Way Unit D
- 1780 Greenbrae Dr
- 3269 Valley Forge Way
- 3252 Holman Way
- 1945 4th St Unit 32
- 1180 Welling Way
- 1140 Welling Way
- 1165 Xman Way
- 1120 Welling Way
- 1185 Xman Way
- 1220 Welling Way
- 1145 Xman Way
- 1165 Welling Way
- 1125 Xman Way
- 1225 Xman Way
- 1185 Welling Way
- 1145 Welling Way
- 1225 Welling Way
- 1110 Welling Way
- 1240 Welling Way
- 1125 Welling Way
- 1245 Xman Way
- 1115 Xman Way
- 1245 Welling Way
- 1115 Welling Way