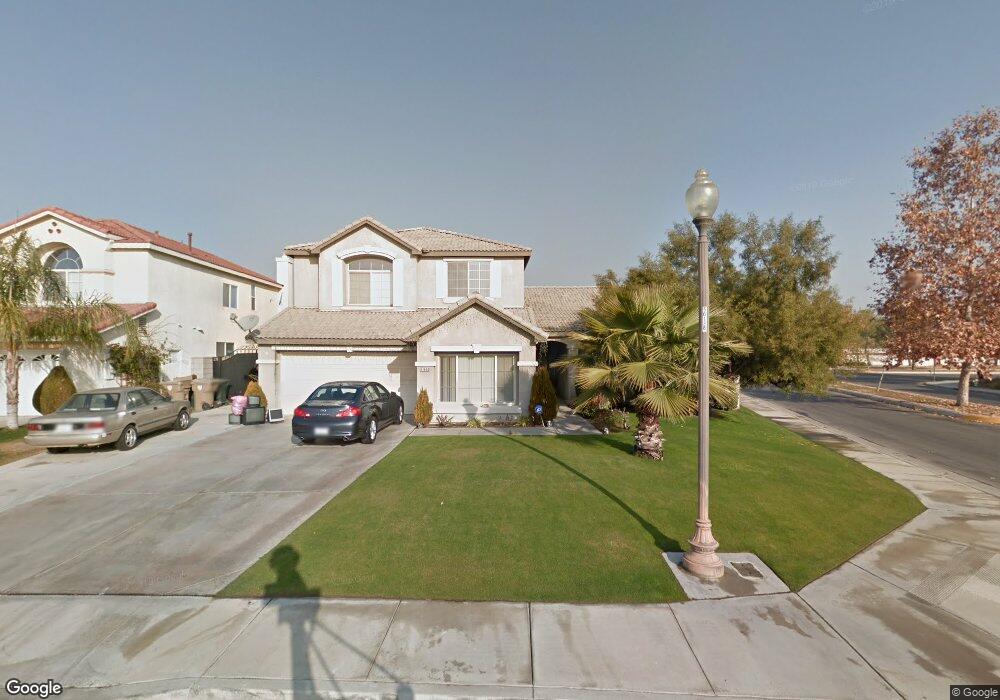
11600 Clarion River Dr Unit 3 Bakersfield, CA 93311
River Oaks NeighborhoodEstimated Value: $579,040 - $664,000
6
Beds
4
Baths
2,065
Sq Ft
$306/Sq Ft
Est. Value
About This Home
This home is located at 11600 Clarion River Dr Unit 3, Bakersfield, CA 93311 and is currently estimated at $632,260, approximately $306 per square foot. 11600 Clarion River Dr Unit 3 is a home located in Kern County with nearby schools including Ronald Reagan Elementary School, Earl Warren Junior High School, and Stockdale High School.
Ownership History
Date
Name
Owned For
Owner Type
Purchase Details
Closed on
Jul 16, 2024
Sold by
Bhogal Ajmer S and Bhogal Kuldip K
Bought by
Bhogal Kuldip K
Current Estimated Value
Purchase Details
Closed on
Dec 5, 2003
Sold by
Fredrick Judith L
Bought by
Bhogal Ajmer S and Bhogal Kuldip K
Home Financials for this Owner
Home Financials are based on the most recent Mortgage that was taken out on this home.
Original Mortgage
$288,000
Interest Rate
5.25%
Mortgage Type
Purchase Money Mortgage
Purchase Details
Closed on
Mar 1, 2002
Sold by
Communities At River Oaks Llc
Bought by
Fredrick Judith L
Home Financials for this Owner
Home Financials are based on the most recent Mortgage that was taken out on this home.
Original Mortgage
$225,990
Interest Rate
6.52%
Create a Home Valuation Report for This Property
The Home Valuation Report is an in-depth analysis detailing your home's value as well as a comparison with similar homes in the area
Home Values in the Area
Average Home Value in this Area
Purchase History
| Date | Buyer | Sale Price | Title Company |
|---|---|---|---|
| Bhogal Kuldip K | -- | None Listed On Document | |
| Bhogal Ajmer S | $320,000 | Chicago Title | |
| Fredrick Judith L | $251,500 | American Title Co |
Source: Public Records
Mortgage History
| Date | Status | Borrower | Loan Amount |
|---|---|---|---|
| Previous Owner | Bhogal Ajmer S | $288,000 | |
| Previous Owner | Fredrick Judith L | $225,990 |
Source: Public Records
Tax History Compared to Growth
Tax History
| Year | Tax Paid | Tax Assessment Tax Assessment Total Assessment is a certain percentage of the fair market value that is determined by local assessors to be the total taxable value of land and additions on the property. | Land | Improvement |
|---|---|---|---|---|
| 2025 | $6,139 | $454,952 | $79,609 | $375,343 |
| 2024 | $6,061 | $446,033 | $78,049 | $367,984 |
| 2023 | $6,061 | $437,288 | $76,519 | $360,769 |
| 2022 | $5,830 | $428,715 | $75,019 | $353,696 |
| 2021 | $5,685 | $420,310 | $73,549 | $346,761 |
| 2020 | $5,612 | $416,001 | $72,795 | $343,206 |
| 2019 | $5,543 | $416,001 | $72,795 | $343,206 |
| 2018 | $5,456 | $399,849 | $69,969 | $329,880 |
| 2017 | $5,422 | $392,010 | $68,598 | $323,412 |
| 2016 | $5,034 | $384,324 | $67,253 | $317,071 |
| 2015 | $4,997 | $378,552 | $66,243 | $312,309 |
| 2014 | $4,881 | $371,138 | $64,946 | $306,192 |
Source: Public Records
Map
Nearby Homes
- 11415 White River Dr
- 11505 Orchard Park Dr
- 1118 Bluestone River Way
- 803 Mountain Park Dr Unit 2
- 1214 Deschules Creek Ln
- 11526 Privet Place
- 1304 Torulosa Dr
- 11519 Privet Place
- 11805 Crescent Creek Ct
- 11224 Bright Water Way
- 12012 Tulane Park Place
- 1103 Carpenter Ct
- 11814 Grecian Laurel Dr
- 1503 English Fry St
- 1001 Sungro Way
- 1500 Wedgewood Dr
- 12200 White Rapids Way
- 10904 Rockridge Way
- 11502 Crabbet Park Dr
- 11902 Bedfordshire Dr
- 11604 Clarion River Dr Unit 3
- 11608 Clarion River Dr
- 11514 Clarion River Dr Unit 1
- 11612 Clarion River Dr
- 11601 Clarion River Dr
- 11605 Clarion River Dr
- 11510 Clarion River Dr Unit 1
- 11515 Clarion River Dr
- 11609 Clarion River Dr
- 824 Astoria Park Dr
- 11511 Clarion River Dr Unit 1
- 11616 Clarion River Dr
- 11506 Clarion River Dr Unit 1
- 11613 Clarion River Dr Unit 3
- 825 Astoria Park Dr Unit 1
- 11503 Clarion River Dr
- 820 Astoria Park Dr
- 11602 White River Dr Unit 2
- 11702 Clarion River Dr Unit 3
- 11508 White River Dr