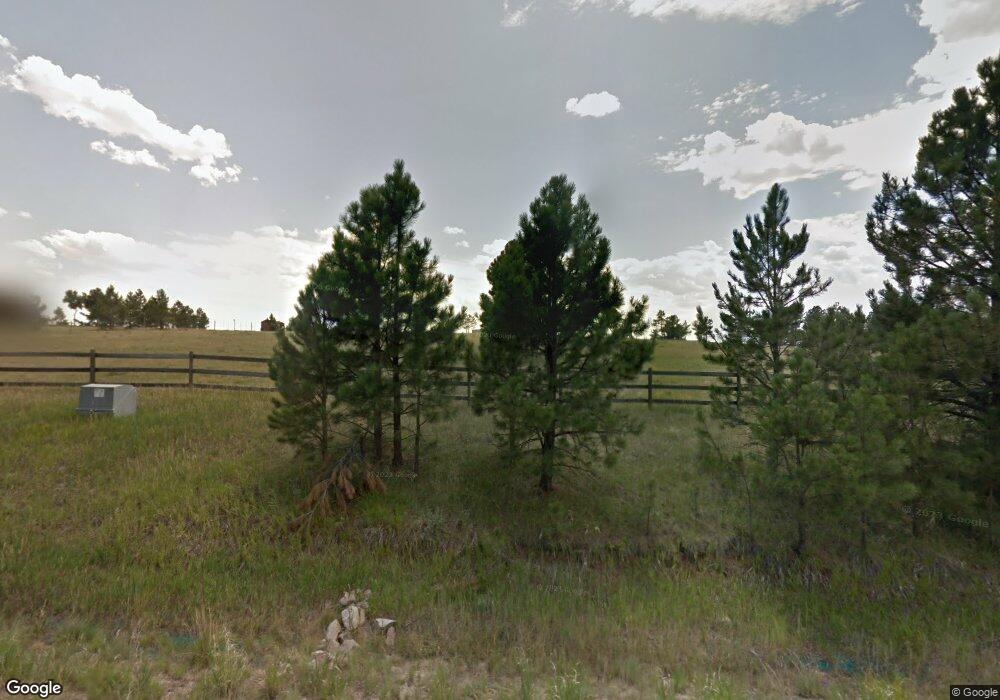
11600 E Tomichi Dr Franktown, CO 80116
Estimated Value: $400,000 - $764,612
--
Bed
--
Bath
408
Sq Ft
$1,444/Sq Ft
Est. Value
About This Home
This home is located at 11600 E Tomichi Dr, Franktown, CO 80116 and is currently estimated at $589,204, approximately $1,444 per square foot. 11600 E Tomichi Dr is a home located in Douglas County with nearby schools including Franktown Elementary School, Sagewood Middle School, and Ponderosa High School.
Ownership History
Date
Name
Owned For
Owner Type
Purchase Details
Closed on
May 13, 2003
Sold by
Hume Candace B
Bought by
Hume Jack William and Hume Candace Ann
Current Estimated Value
Purchase Details
Closed on
Nov 14, 1997
Sold by
Lunnon Donald
Bought by
Hume Jack W and Hume Candace B
Home Financials for this Owner
Home Financials are based on the most recent Mortgage that was taken out on this home.
Original Mortgage
$60,825
Interest Rate
10.95%
Purchase Details
Closed on
Feb 28, 1997
Sold by
Moore Thomas
Bought by
Lunnon Donald
Purchase Details
Closed on
Oct 11, 1996
Sold by
Halsted Daniel and Halsted Louan
Bought by
Nationsbank
Purchase Details
Closed on
Feb 29, 1988
Sold by
Cherry Creek National Bank
Bought by
Halsted Daniel and Halsted Louan
Purchase Details
Closed on
Mar 11, 1987
Sold by
Flyckt Gerald M and Flyckt Bettie J
Bought by
Cherry Creek National Bank
Purchase Details
Closed on
Mar 29, 1974
Sold by
Nagle Charles O and Nagel Linda S
Bought by
Flyckt Gerald M and Flyckt Bettie J
Create a Home Valuation Report for This Property
The Home Valuation Report is an in-depth analysis detailing your home's value as well as a comparison with similar homes in the area
Home Values in the Area
Average Home Value in this Area
Purchase History
| Date | Buyer | Sale Price | Title Company |
|---|---|---|---|
| Hume Jack William | -- | -- | |
| Hume Jack W | $90,000 | -- | |
| Lunnon Donald | $285,000 | -- | |
| Nationsbank | -- | -- | |
| Halsted Daniel | -- | -- | |
| Cherry Creek National Bank | -- | -- | |
| Flyckt Gerald M | $12,500 | -- |
Source: Public Records
Mortgage History
| Date | Status | Borrower | Loan Amount |
|---|---|---|---|
| Closed | Hume Jack W | $60,825 |
Source: Public Records
Tax History Compared to Growth
Tax History
| Year | Tax Paid | Tax Assessment Tax Assessment Total Assessment is a certain percentage of the fair market value that is determined by local assessors to be the total taxable value of land and additions on the property. | Land | Improvement |
|---|---|---|---|---|
| 2024 | $2,779 | $32,240 | $32,100 | $140 |
| 2023 | $2,810 | $32,240 | $32,100 | $140 |
| 2022 | $1,829 | $21,840 | $21,730 | $110 |
| 2021 | $1,895 | $21,840 | $21,730 | $110 |
| 2020 | $1,422 | $16,770 | $16,670 | $100 |
| 2019 | $1,429 | $16,770 | $16,670 | $100 |
| 2018 | $1,129 | $13,020 | $12,920 | $100 |
| 2017 | $1,051 | $13,020 | $12,920 | $100 |
| 2016 | $786 | $9,540 | $9,430 | $110 |
| 2015 | $803 | $9,540 | $9,430 | $110 |
| 2014 | $417 | $9,250 | $9,150 | $100 |
Source: Public Records
Map
Nearby Homes
- 2072 Summit St
- 11274 E Manitou Rd
- 1341 Tomichi Dr
- 210 High Meadows Loop
- 1972 Gold Camp Way
- 1133 Tomichi Dr
- 1559 Apex Rd
- 575 Heritage Trail
- 30999 Kootney St
- 32555 Legacy Ridge St
- 856 Woodridge Rd
- 31203 Longhorn Cir
- 32660 Legacy Ridge St
- 0 Kootney St
- 980 Promontory Cir
- 11044 Conestoga Place
- 1571 Arrowpoint Ct
- 1561 Arrowpoint Ct
- 1555 Arrowpoint Ct
- 10400 Pine Valley Dr
- 11530 Tomichi Dr
- 11674 Tomichi Dr
- 11531 Tomichi Dr
- 11579 Tomichi Dr
- 11635 Tomichi Dr
- 11706 Tomichi Dr Unit 6
- 1948 Summit St
- 11495 Tomichi Dr
- 11784 Tomichi Dr
- 11884 E Caribou Dr
- 1981 Summit St
- 11810 Caribou Dr
- 2075 Summit St
- 11722 Caribou Dr
- 11546 Caribou Dr
- 0 Summit Rd
- 11340 Tomichi Dr
- 2230 Summit St
- 11480 Caribou Dr
- 11375 E Tomichi Dr