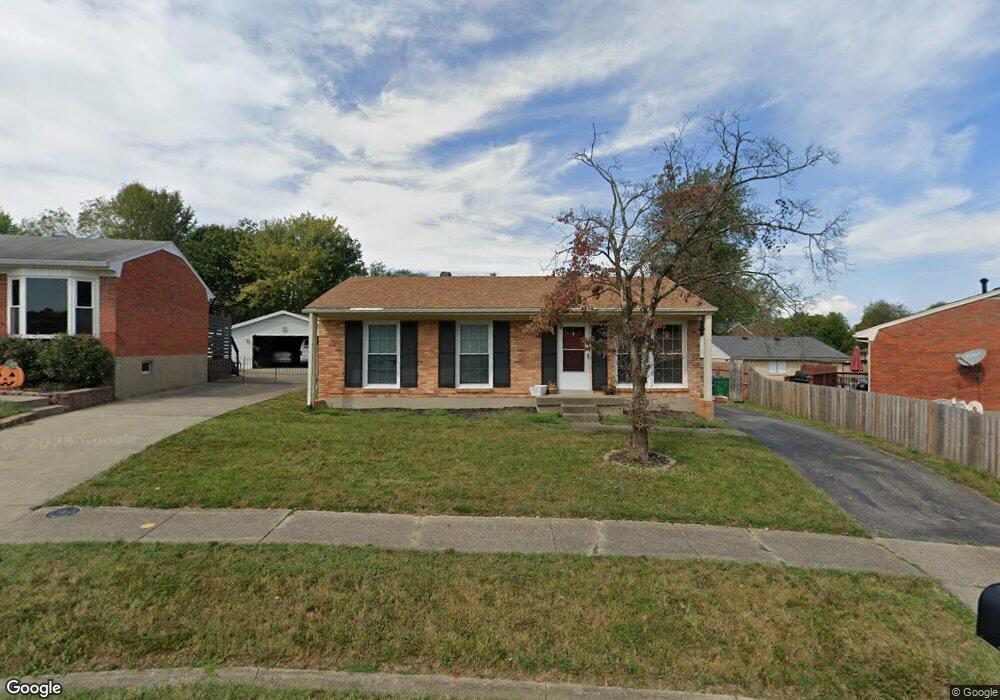
11602 Maple Way Louisville, KY 40229
Estimated Value: $231,000 - $242,000
3
Beds
1
Bath
1,650
Sq Ft
$143/Sq Ft
Est. Value
About This Home
This home is located at 11602 Maple Way, Louisville, KY 40229 and is currently estimated at $235,826, approximately $142 per square foot. 11602 Maple Way is a home located in Jefferson County with nearby schools including Laukhuf Elementary School, Blue Lick Elementary School, and Okolona Elementary School.
Ownership History
Date
Name
Owned For
Owner Type
Purchase Details
Closed on
Feb 16, 2024
Sold by
Apex Investment Properties Llc
Bought by
Mattingly Joseph T and Mattingly Pamela R
Current Estimated Value
Home Financials for this Owner
Home Financials are based on the most recent Mortgage that was taken out on this home.
Original Mortgage
$114,000
Outstanding Balance
$112,004
Interest Rate
6.66%
Mortgage Type
New Conventional
Estimated Equity
$123,822
Purchase Details
Closed on
May 18, 2021
Sold by
Morgan Neil Properties Inc
Bought by
Apex Investment Properits Llc
Purchase Details
Closed on
Aug 21, 2008
Sold by
Federal National Mortgage Association
Bought by
Morgan Neil Properties Inc
Home Financials for this Owner
Home Financials are based on the most recent Mortgage that was taken out on this home.
Original Mortgage
$75,687
Interest Rate
6.32%
Mortgage Type
Construction
Create a Home Valuation Report for This Property
The Home Valuation Report is an in-depth analysis detailing your home's value as well as a comparison with similar homes in the area
Home Values in the Area
Average Home Value in this Area
Purchase History
| Date | Buyer | Sale Price | Title Company |
|---|---|---|---|
| Mattingly Joseph T | -- | None Listed On Document | |
| Mattingly Joseph T | -- | None Listed On Document | |
| Apex Investment Properits Llc | -- | None Available | |
| Morgan Neil Properties Inc | $80,000 | None Available |
Source: Public Records
Mortgage History
| Date | Status | Borrower | Loan Amount |
|---|---|---|---|
| Open | Mattingly Joseph T | $114,000 | |
| Closed | Mattingly Joseph T | $114,000 | |
| Previous Owner | Morgan Neil Properties Inc | $75,687 |
Source: Public Records
Tax History Compared to Growth
Tax History
| Year | Tax Paid | Tax Assessment Tax Assessment Total Assessment is a certain percentage of the fair market value that is determined by local assessors to be the total taxable value of land and additions on the property. | Land | Improvement |
|---|---|---|---|---|
| 2024 | $1,919 | $169,060 | $30,000 | $139,060 |
| 2023 | $1,975 | $169,060 | $30,000 | $139,060 |
| 2022 | $1,981 | $100,790 | $24,000 | $76,790 |
| 2021 | $1,275 | $100,790 | $24,000 | $76,790 |
| 2020 | $1,186 | $100,790 | $24,000 | $76,790 |
| 2019 | $1,092 | $100,790 | $24,000 | $76,790 |
| 2018 | $1,079 | $100,790 | $24,000 | $76,790 |
| 2017 | $1,058 | $100,790 | $24,000 | $76,790 |
| 2013 | $953 | $95,300 | $20,000 | $75,300 |
Source: Public Records
Map
Nearby Homes
- 11704 Maple Way
- 5312 Mount Washington Rd
- 5502 Sullivan Way
- 10007 Charleswood Rd
- 5406 Wild Horse Ct
- 10512 Clayton Allen Blvd
- 5202 Rainmaker Ct
- 5513 Antle Dr
- 5306 Wild River Ct
- Lot 28 Brookley Place
- 9707 Preston Spring Dr
- 6902 Charles Lindsey Ct
- 9415 River Trail Dr
- 6516 Brook Bend Way Unit 134
- 10906 Brookley Dr
- 10904 Brookley Dr
- 6909 Samuel Long Way
- 11216 Pyramid Rd
- 9606 Preston Spring Dr Unit 104
- 5000 Oldshire Rd
- 11604 Maple Way
- 5324 Haventree Place
- 5320 Haventree Ct
- 5318 Haventree Ct
- 5322 Haventree Place
- 11603 Maple Way
- 11608 Maple Way
- 11601 Maple Way
- 11605 Maple Way
- 5325 Haventree Place
- 5316 Haventree Ct
- 5311 Chasewood Place
- 11511 Maple Way
- 11506 Maple Way
- 5323 Haventree Place
- 11607 Maple Way
- 36 Wooden Horse Dr
- 5321 Haventree Place
- 5309 Chasewood Place
- 11509 Maple Way