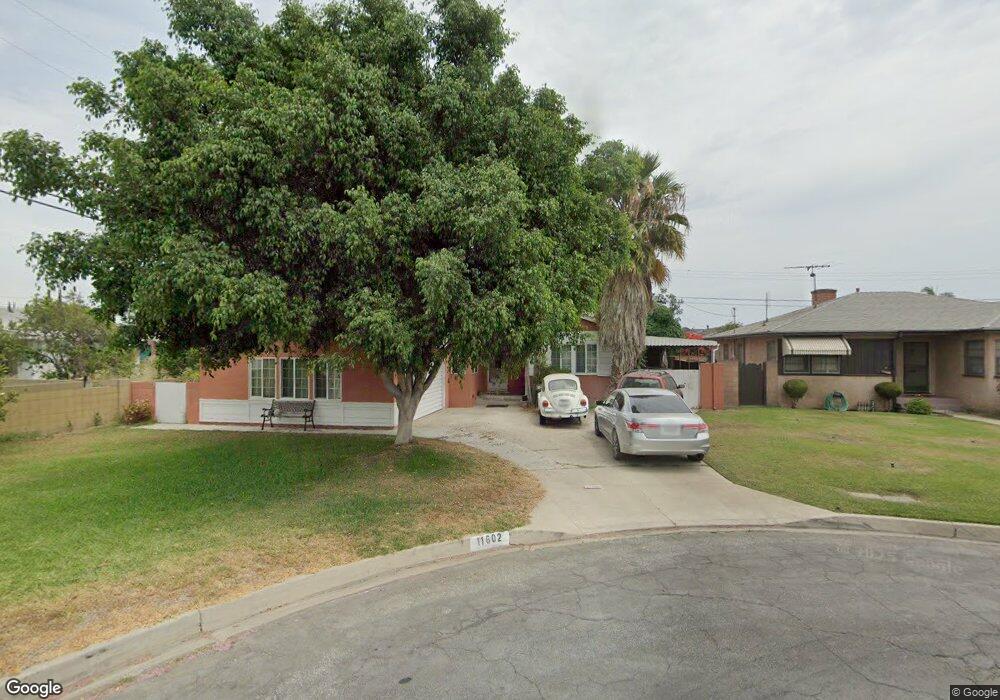
11602 Susan Ave Downey, CA 90241
Estimated Value: $797,000 - $979,000
3
Beds
2
Baths
1,808
Sq Ft
$503/Sq Ft
Est. Value
About This Home
This home is located at 11602 Susan Ave, Downey, CA 90241 and is currently estimated at $909,261, approximately $502 per square foot. 11602 Susan Ave is a home located in Los Angeles County with nearby schools including Williams Elementary School, Old River Elementary School, and West Middle School.
Ownership History
Date
Name
Owned For
Owner Type
Purchase Details
Closed on
Jun 10, 2010
Sold by
Chavez Manuel and Chavez Estela
Bought by
Granados Francisco and Sanchez Juan Guillermo
Current Estimated Value
Home Financials for this Owner
Home Financials are based on the most recent Mortgage that was taken out on this home.
Original Mortgage
$397,664
Outstanding Balance
$270,150
Interest Rate
5.25%
Mortgage Type
FHA
Estimated Equity
$639,111
Purchase Details
Closed on
Aug 18, 2006
Sold by
Squibb George H and Squibb Hilda C
Bought by
Chavez Manuel and Chavez Estela
Home Financials for this Owner
Home Financials are based on the most recent Mortgage that was taken out on this home.
Original Mortgage
$489,600
Interest Rate
6.43%
Mortgage Type
Purchase Money Mortgage
Purchase Details
Closed on
Nov 15, 1995
Sold by
Squibb George Henry and Squibb Hilda Catherine
Bought by
Squibb George H and Squibb Hilda C
Create a Home Valuation Report for This Property
The Home Valuation Report is an in-depth analysis detailing your home's value as well as a comparison with similar homes in the area
Home Values in the Area
Average Home Value in this Area
Purchase History
| Date | Buyer | Sale Price | Title Company |
|---|---|---|---|
| Granados Francisco | $405,000 | Old Republic Title | |
| Chavez Manuel | $612,000 | Fatcola | |
| Squibb George H | -- | -- |
Source: Public Records
Mortgage History
| Date | Status | Borrower | Loan Amount |
|---|---|---|---|
| Open | Granados Francisco | $397,664 | |
| Previous Owner | Chavez Manuel | $489,600 |
Source: Public Records
Tax History Compared to Growth
Tax History
| Year | Tax Paid | Tax Assessment Tax Assessment Total Assessment is a certain percentage of the fair market value that is determined by local assessors to be the total taxable value of land and additions on the property. | Land | Improvement |
|---|---|---|---|---|
| 2025 | $6,671 | $522,765 | $322,439 | $200,326 |
| 2024 | $6,671 | $512,516 | $316,117 | $196,399 |
| 2023 | $6,447 | $502,468 | $309,919 | $192,549 |
| 2022 | $6,126 | $492,617 | $303,843 | $188,774 |
| 2021 | $5,991 | $482,959 | $297,886 | $185,073 |
| 2019 | $5,839 | $468,636 | $289,051 | $179,585 |
| 2018 | $5,651 | $459,448 | $283,384 | $176,064 |
| 2016 | $5,478 | $441,609 | $272,381 | $169,228 |
| 2015 | $5,401 | $434,977 | $268,290 | $166,687 |
| 2014 | $5,098 | $426,457 | $263,035 | $163,422 |
Source: Public Records
Map
Nearby Homes
- 11619 Haro Ave
- 7370 Neo St
- 7214 Luxor St
- 11506 Adco Ave
- 11919 Susan Ave
- 9301 Karmont Ave
- 7640 Stewart And Gray Rd
- 9549 Karmont Ave
- 7370 Rio Hondo Place
- 10930 Rio Hondo Dr
- 7847 Brookmill Rd
- 10702 Old River School Rd
- 12066 Horley Ave
- 11715 Samoline Ave
- 8306 Garfield Ave Unit 8308
- 6017 Buell St
- 7442 Hondo St
- 7845 5th St
- 12307 Rives Ave
- 7312 Quill Dr Unit 16