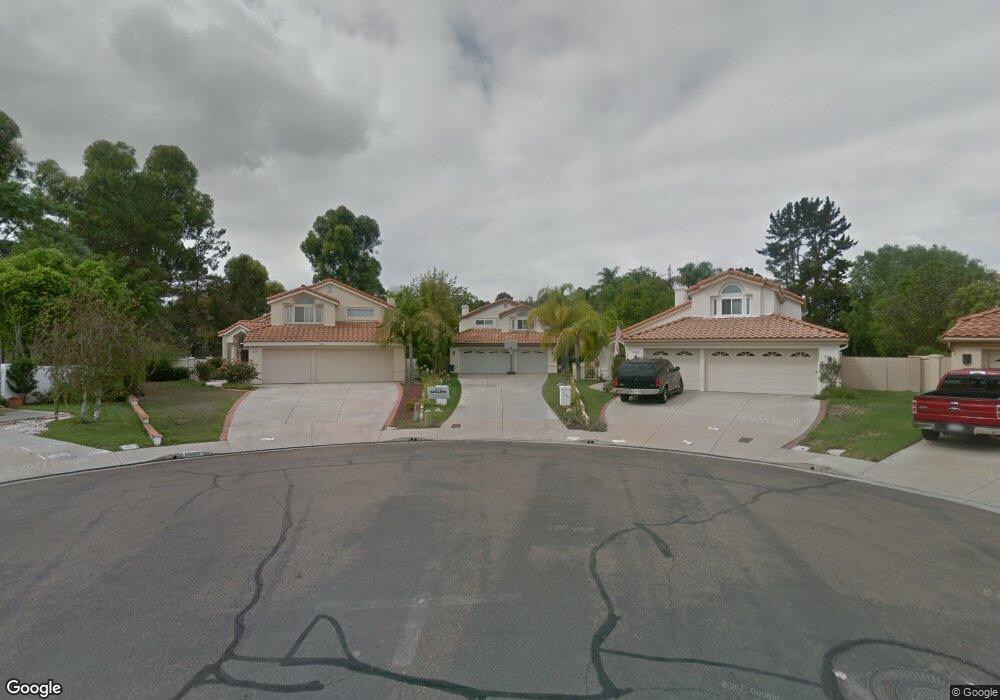
11603 Via Firul San Diego, CA 92128
Rancho Bernardo NeighborhoodEstimated Value: $1,665,000 - $1,770,874
5
Beds
3
Baths
2,665
Sq Ft
$644/Sq Ft
Est. Value
About This Home
This home is located at 11603 Via Firul, San Diego, CA 92128 and is currently estimated at $1,716,219, approximately $643 per square foot. 11603 Via Firul is a home located in San Diego County with nearby schools including Highland Ranch Elementary School, Bernardo Heights Middle, and Rancho Bernardo High.
Ownership History
Date
Name
Owned For
Owner Type
Purchase Details
Closed on
Sep 13, 2011
Sold by
Fornaca Ronald and Fornaca Cathy
Bought by
Smith Jared Ephraim and Smith Jennifer Scott
Current Estimated Value
Home Financials for this Owner
Home Financials are based on the most recent Mortgage that was taken out on this home.
Original Mortgage
$564,080
Outstanding Balance
$382,382
Interest Rate
4.05%
Mortgage Type
New Conventional
Estimated Equity
$1,333,837
Purchase Details
Closed on
Oct 23, 2002
Sold by
Fornaca Ronald J and Fornaca Cathy A
Bought by
Fornaca Ronald and Fornaca Cathy
Purchase Details
Closed on
Aug 16, 2000
Sold by
Schauder 1993 Revocable Living Trust
Bought by
Fornaca Ronald J and Fornaca Cathy A
Home Financials for this Owner
Home Financials are based on the most recent Mortgage that was taken out on this home.
Original Mortgage
$371,600
Interest Rate
7.75%
Purchase Details
Closed on
Jul 22, 1993
Sold by
Schauder Paul S and Schauder Joan B
Bought by
Schauder Paul S and Schauder Joan B
Purchase Details
Closed on
Jan 30, 1987
Create a Home Valuation Report for This Property
The Home Valuation Report is an in-depth analysis detailing your home's value as well as a comparison with similar homes in the area
Home Values in the Area
Average Home Value in this Area
Purchase History
| Date | Buyer | Sale Price | Title Company |
|---|---|---|---|
| Smith Jared Ephraim | $706,000 | None Available | |
| Fornaca Ronald | -- | -- | |
| Fornaca Ronald J | $464,500 | Fidelity National Title | |
| Schauder Paul S | -- | -- | |
| -- | $205,000 | -- |
Source: Public Records
Mortgage History
| Date | Status | Borrower | Loan Amount |
|---|---|---|---|
| Open | Smith Jared Ephraim | $564,080 | |
| Previous Owner | Fornaca Ronald J | $371,600 |
Source: Public Records
Tax History Compared to Growth
Tax History
| Year | Tax Paid | Tax Assessment Tax Assessment Total Assessment is a certain percentage of the fair market value that is determined by local assessors to be the total taxable value of land and additions on the property. | Land | Improvement |
|---|---|---|---|---|
| 2025 | $9,728 | $885,631 | $304,434 | $581,197 |
| 2024 | $9,728 | $868,266 | $298,465 | $569,801 |
| 2023 | $9,521 | $851,242 | $292,613 | $558,629 |
| 2022 | $9,360 | $834,552 | $286,876 | $547,676 |
| 2021 | $9,237 | $818,189 | $281,251 | $536,938 |
| 2020 | $9,111 | $809,801 | $278,368 | $531,433 |
| 2019 | $8,873 | $793,923 | $272,910 | $521,013 |
| 2018 | $8,621 | $778,357 | $267,559 | $510,798 |
| 2017 | $8,389 | $763,096 | $262,313 | $500,783 |
| 2016 | $8,216 | $748,134 | $257,170 | $490,964 |
| 2015 | $8,093 | $736,898 | $253,308 | $483,590 |
| 2014 | $7,900 | $722,465 | $248,347 | $474,118 |
Source: Public Records
Map
Nearby Homes
- 12007 Alta Carmel Ct Unit 325
- 12055 Alta Carmel Ct Unit 185
- 12015 Alta Carmel Ct Unit 299
- 12059 Alta Carmel Ct Unit 167
- 12047 Alta Carmel Ct Unit 189
- 15048 Avenida Venusto Unit 260
- 15389 Avenida Rorras
- 15032 Avenida Venusto Unit 179
- 11385 Paseo Albacete
- 11378 Ajanta Ct
- 12152 Royal Birkdale Row Unit B
- 12122 Royal Birkdale Row Unit 403
- 12132 Royal Birkdale Row Unit 303 E
- 12132 Royal Birkdale Row
- 15541 Paseo Jenghiz
- 15547 Paseo Jenghiz
- 13124 Greer Dr
- 11705 Via Medanos
- 15576 Paseo Ajanta
- 15589 Paseo Jenghiz
- 11609 Via Firul
- 11602 Via Firul
- 11639 Via Tavito
- 11625 Via Tavito
- 11655 Via Tavito
- 11617 Via Firul
- 11612 Via Firul
- 11661 Via Tavito
- 11667 Via Tavito
- 11625 Via Firul
- 11673 Via Tavito
- 11615 Via Tavito
- 11620 Via Firul
- 11635 Via Firul
- 11679 Via Tavito
- 11638 Via Firul
- 11645 Via Firul
- 11685 Via Tavito
- 11603 Via Tavito
- 11652 Via Firul