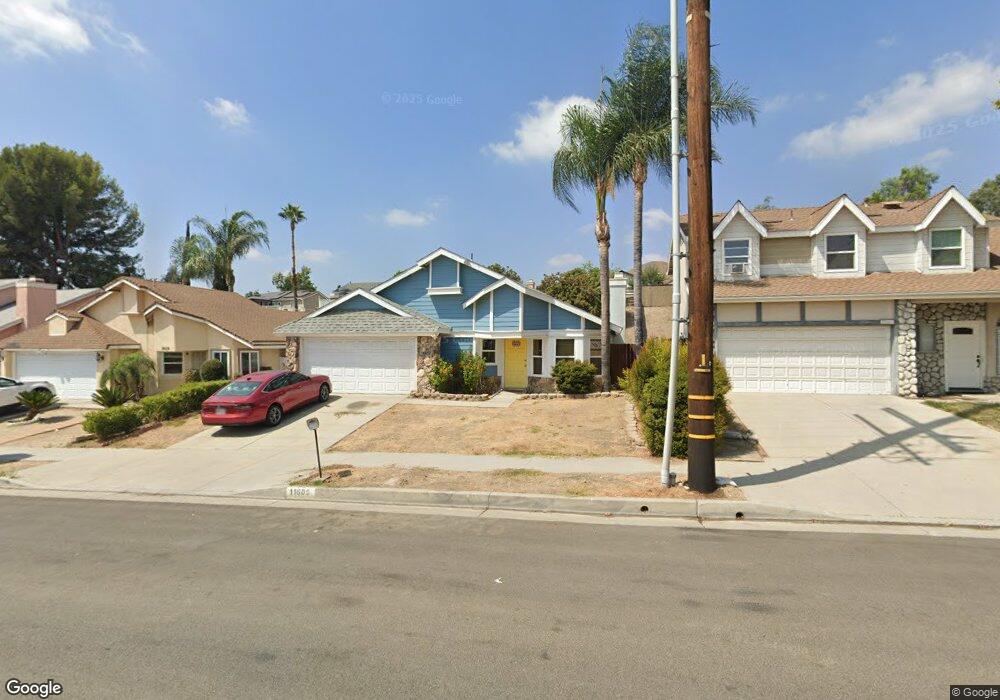
11605 Terra Bella St Sylmar, CA 91342
Estimated Value: $727,000 - $828,000
3
Beds
2
Baths
1,132
Sq Ft
$682/Sq Ft
Est. Value
About This Home
This home is located at 11605 Terra Bella St, Sylmar, CA 91342 and is currently estimated at $772,406, approximately $682 per square foot. 11605 Terra Bella St is a home located in Los Angeles County with nearby schools including Charles Maclay Middle School, San Fernando Senior High School, and Fenton Avenue Charter School.
Ownership History
Date
Name
Owned For
Owner Type
Purchase Details
Closed on
Feb 19, 2009
Sold by
Gomez Gloria
Bought by
Rivera Consuelo
Current Estimated Value
Home Financials for this Owner
Home Financials are based on the most recent Mortgage that was taken out on this home.
Original Mortgage
$200,000
Outstanding Balance
$126,018
Interest Rate
5.04%
Mortgage Type
Purchase Money Mortgage
Estimated Equity
$646,388
Purchase Details
Closed on
Sep 22, 2008
Sold by
Gomez Alfredo
Bought by
Gomez Gloria
Purchase Details
Closed on
Apr 27, 2006
Sold by
Dean Shawn and The Laverne Chapman Trust
Bought by
Gomez Alfredo
Home Financials for this Owner
Home Financials are based on the most recent Mortgage that was taken out on this home.
Original Mortgage
$404,000
Interest Rate
6.95%
Mortgage Type
Purchase Money Mortgage
Purchase Details
Closed on
Aug 14, 2001
Sold by
Chapman Laverne M
Bought by
Chapman Laverne and The Laverne Chapman Trust
Create a Home Valuation Report for This Property
The Home Valuation Report is an in-depth analysis detailing your home's value as well as a comparison with similar homes in the area
Home Values in the Area
Average Home Value in this Area
Purchase History
| Date | Buyer | Sale Price | Title Company |
|---|---|---|---|
| Rivera Consuelo | $250,000 | Chicago Title Company | |
| Gomez Gloria | -- | Accommodation | |
| Gomez Alfredo | $505,000 | Landsafe Title | |
| Chapman Laverne | -- | -- |
Source: Public Records
Mortgage History
| Date | Status | Borrower | Loan Amount |
|---|---|---|---|
| Open | Rivera Consuelo | $200,000 | |
| Previous Owner | Gomez Alfredo | $404,000 |
Source: Public Records
Tax History Compared to Growth
Tax History
| Year | Tax Paid | Tax Assessment Tax Assessment Total Assessment is a certain percentage of the fair market value that is determined by local assessors to be the total taxable value of land and additions on the property. | Land | Improvement |
|---|---|---|---|---|
| 2025 | $4,044 | $321,921 | $146,410 | $175,511 |
| 2024 | $4,044 | $315,610 | $143,540 | $172,070 |
| 2023 | $3,966 | $309,423 | $140,726 | $168,697 |
| 2022 | $3,781 | $303,357 | $137,967 | $165,390 |
| 2021 | $3,728 | $297,410 | $135,262 | $162,148 |
| 2019 | $3,587 | $288,591 | $131,251 | $157,340 |
| 2018 | $3,501 | $282,933 | $128,678 | $154,255 |
| 2016 | $3,338 | $271,948 | $123,682 | $148,266 |
| 2015 | $3,290 | $267,864 | $121,825 | $146,039 |
| 2014 | $3,307 | $262,618 | $119,439 | $143,179 |
Source: Public Records
Map
Nearby Homes
- 11645 N Delft Ln
- 11715 Garrick Ave
- 0 Terra Vista Way
- 11555 Eldridge Ave
- 11609 Garrick Ave
- 11569 Bonham Ave
- 11374 Hela Ave
- 0 Kagel Canyon Unit 25533613
- 11926 Kathyann St
- 11235 Sunburst St
- 11523 Vanport Ave
- 11377 Osborne Place Unit 34
- 11361 Eldridge Ave
- 12047 Kagel Canyon Rd
- 12055 Kagel Canyon Rd
- 0 Veranda Dr Unit CV25177332
- 12036 Jouett St
- 11377 Gladstone Ave
- 11350 Foothill Blvd Unit 15
- 11350 Foothill Blvd Unit 30
- 11601 Terra Bella St
- 11609 Terra Bella St
- 11591 Terra Bella St
- 11615 Terra Bella St
- 11618 Remington St
- 11614 Remington St
- 11626 Remington St
- 11587 Terra Bella St
- 11619 Terra Bella St
- 11612 Remington St
- 11654 N Delft Ln
- 11665 N Hilltop Ln
- 11630 Remington St
- 11623 Terra Bella St
- 11581 Terra Bella St
- 11653 N Delft Ln
- 11650 N Delft Ln
- 11661 N Hilltop Ln
- 11632 Luanda St
- 11664 N Hilltop Ln