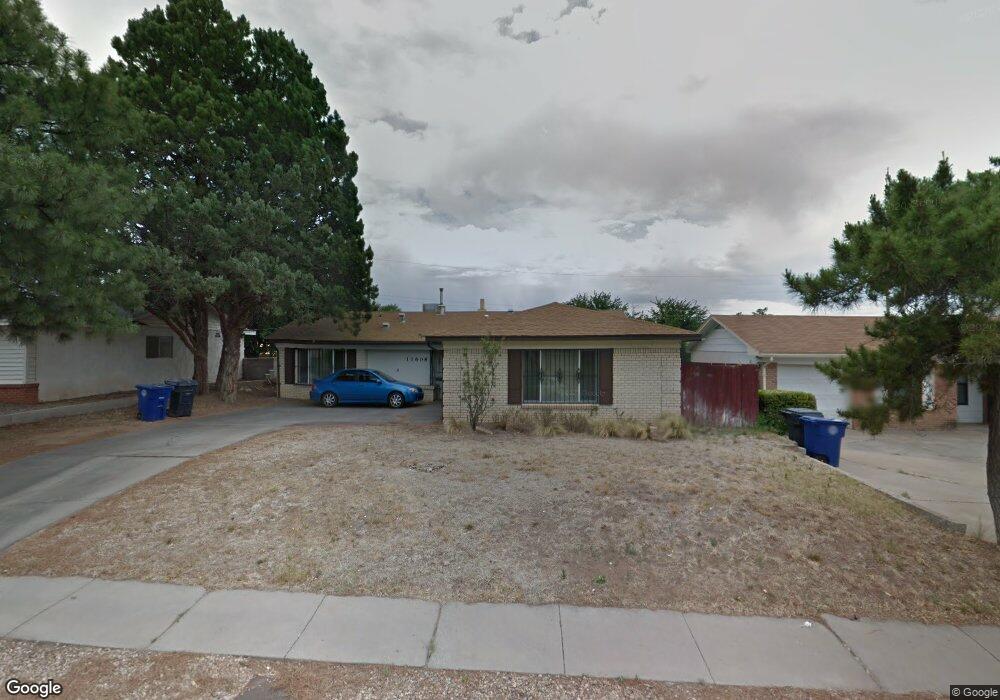
11608 Palm Springs Ave NE Albuquerque, NM 87111
Holiday Park NeighborhoodEstimated Value: $318,000 - $361,000
3
Beds
2
Baths
1,298
Sq Ft
$261/Sq Ft
Est. Value
About This Home
This home is located at 11608 Palm Springs Ave NE, Albuquerque, NM 87111 and is currently estimated at $338,404, approximately $260 per square foot. 11608 Palm Springs Ave NE is a home located in Bernalillo County with nearby schools including Eldorado High School, John Baker Elementary School, and Hoover Middle School.
Ownership History
Date
Name
Owned For
Owner Type
Purchase Details
Closed on
Jun 23, 2011
Sold by
Rosecrans Benjamin D
Bought by
Rosecrans Benjamin D and Rosecrans Amanda
Current Estimated Value
Home Financials for this Owner
Home Financials are based on the most recent Mortgage that was taken out on this home.
Original Mortgage
$185,000
Outstanding Balance
$127,953
Interest Rate
4.7%
Mortgage Type
VA
Estimated Equity
$210,451
Purchase Details
Closed on
Oct 2, 2009
Sold by
Banh Liang P
Bought by
Banh Liang P and Fate Jessica L
Purchase Details
Closed on
Mar 30, 2005
Sold by
Fresquez Chris P
Bought by
Banh Liang P
Home Financials for this Owner
Home Financials are based on the most recent Mortgage that was taken out on this home.
Original Mortgage
$148,430
Interest Rate
5.71%
Mortgage Type
Purchase Money Mortgage
Create a Home Valuation Report for This Property
The Home Valuation Report is an in-depth analysis detailing your home's value as well as a comparison with similar homes in the area
Home Values in the Area
Average Home Value in this Area
Purchase History
| Date | Buyer | Sale Price | Title Company |
|---|---|---|---|
| Rosecrans Benjamin D | -- | U S Title | |
| Rosecrans Benjamin D | -- | U S Title | |
| Banh Liang P | -- | Accommodation | |
| Banh Liang P | -- | Fidelity National Title Co |
Source: Public Records
Mortgage History
| Date | Status | Borrower | Loan Amount |
|---|---|---|---|
| Open | Rosecrans Benjamin D | $185,000 | |
| Previous Owner | Banh Liang P | $148,430 |
Source: Public Records
Tax History Compared to Growth
Tax History
| Year | Tax Paid | Tax Assessment Tax Assessment Total Assessment is a certain percentage of the fair market value that is determined by local assessors to be the total taxable value of land and additions on the property. | Land | Improvement |
|---|---|---|---|---|
| 2025 | -- | $60,847 | $15,321 | $45,526 |
| 2024 | -- | $59,075 | $14,875 | $44,200 |
| 2023 | $0 | $57,355 | $14,442 | $42,913 |
| 2022 | $0 | $55,685 | $14,022 | $41,663 |
| 2021 | $0 | $54,063 | $13,613 | $40,450 |
| 2020 | $0 | $52,489 | $13,217 | $39,272 |
| 2019 | $0 | $50,961 | $12,832 | $38,129 |
| 2018 | $0 | $50,961 | $12,832 | $38,129 |
| 2017 | $0 | $49,476 | $12,458 | $37,018 |
| 2016 | $0 | $46,637 | $11,743 | $34,894 |
| 2015 | $45,280 | $45,280 | $11,402 | $33,878 |
| 2014 | -- | $43,961 | $11,070 | $32,891 |
| 2013 | -- | $42,680 | $10,747 | $31,933 |
Source: Public Records
Map
Nearby Homes
- 11609 Palm Springs Ave NE
- 11505 Palm Springs Ave NE
- 11521 Versailles Ave NE
- 2600 Elwood Place NE
- 11720 Golden Gate Ave NE
- 11501 Golden Gate Ave NE
- 12008 Golden Gate Ave NE
- 12100 Candelaria Rd NE
- 12120 Candelaria Rd NE
- 2712 La Charles Dr NE
- 2517 Georgene Dr NE
- 12214 Eric Ct NE
- 3501 Juan Tabo Blvd NE Unit G3
- 3501 Juan Tabo Blvd NE Unit J4
- 3701 Tracy St NE
- 3705 Tracy St NE
- 12305 Claremont Ave NE
- 12120 Phoenix Ave NE
- 12000 Stilwell Place NE Unit C
- 11709 El Solindo Ave NE
- 11604 Palm Springs Ave NE
- 11612 Palm Springs Ave NE
- 11600 Palm Springs Ave NE
- 11616 Palm Springs Ave NE
- 11613 Palm Springs Ave NE
- 11612 Candelaria Rd NE
- 11617 Palm Springs Ave NE
- 11605 Palm Springs Ave NE
- 11618 Candelaria Rd NE
- 11604 Candelaria Rd NE
- 11620 Candelaria Rd NE
- 11622 Candelaria Rd NE
- 11520 Palm Springs Ave NE
- 11700 Palm Springs Ave NE
- 11624 Candelaria Rd NE
- 11601 Palm Springs Ave NE
- 11626 Candelaria Rd NE
- 11701 Palm Springs Ave NE
- 11608 Riviera Rd NE
- 11516 Palm Springs Ave NE