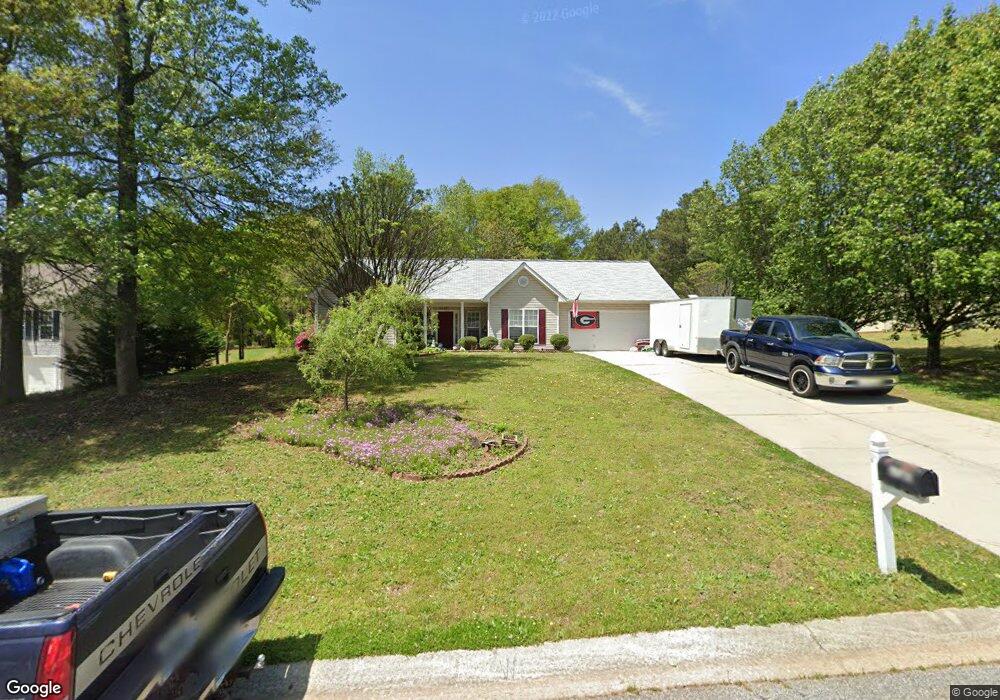
1161 Locust Dr Bethlehem, GA 30620
Estimated Value: $305,000 - $329,804
3
Beds
2
Baths
1,560
Sq Ft
$206/Sq Ft
Est. Value
About This Home
This home is located at 1161 Locust Dr, Bethlehem, GA 30620 and is currently estimated at $321,951, approximately $206 per square foot. 1161 Locust Dr is a home located in Barrow County with nearby schools including Yargo Elementary School, Haymon-Morris Middle School, and Apalachee High School.
Ownership History
Date
Name
Owned For
Owner Type
Purchase Details
Closed on
Nov 5, 2021
Sold by
Skinner Brenda J
Bought by
Skinner Stephanie and Skinner Dylan
Current Estimated Value
Purchase Details
Closed on
Sep 27, 2019
Sold by
Skinner Dylan
Bought by
Skinner Stephanie
Purchase Details
Closed on
Nov 4, 2003
Sold by
Southfork Homes
Bought by
Skinner Brenda
Purchase Details
Closed on
Sep 26, 2003
Sold by
Parkview Development Inc
Bought by
Southfork Homes Inc
Purchase Details
Closed on
May 2, 2000
Bought by
Parkview Development Inc
Create a Home Valuation Report for This Property
The Home Valuation Report is an in-depth analysis detailing your home's value as well as a comparison with similar homes in the area
Home Values in the Area
Average Home Value in this Area
Purchase History
| Date | Buyer | Sale Price | Title Company |
|---|---|---|---|
| Skinner Stephanie | -- | -- | |
| Skinner Stephanie | -- | -- | |
| Coker Wendy L | $230,000 | -- | |
| Skinner Stephanie | -- | -- | |
| Skinner Stephanie | -- | -- | |
| Skinner Brenda | $123,900 | -- | |
| Southfork Homes Inc | -- | -- | |
| Parkview Development Inc | -- | -- |
Source: Public Records
Tax History Compared to Growth
Tax History
| Year | Tax Paid | Tax Assessment Tax Assessment Total Assessment is a certain percentage of the fair market value that is determined by local assessors to be the total taxable value of land and additions on the property. | Land | Improvement |
|---|---|---|---|---|
| 2024 | $2,813 | $111,290 | $25,200 | $86,090 |
| 2023 | $2,819 | $111,890 | $25,200 | $86,690 |
| 2022 | $2,309 | $78,205 | $20,000 | $58,205 |
| 2021 | $2,047 | $68,444 | $16,000 | $52,444 |
| 2020 | $1,818 | $60,764 | $16,000 | $44,764 |
| 2019 | $1,848 | $60,764 | $16,000 | $44,764 |
| 2018 | $588 | $57,964 | $13,200 | $44,764 |
| 2017 | $1,442 | $49,538 | $13,200 | $36,338 |
| 2016 | $498 | $43,596 | $13,200 | $30,396 |
| 2015 | $508 | $43,930 | $13,200 | $30,730 |
| 2014 | $1,096 | $37,533 | $6,468 | $31,065 |
| 2013 | -- | $35,580 | $6,468 | $29,112 |
Source: Public Records
Map
Nearby Homes
- 0 Jb Owens Unit 7552902
- 0 Jb Owens Unit 7552891
- 0 Jb Owens Unit LOT 2 - 2.09 ACRES
- 0 Jb Owens Unit LOT 3 - 2.01 ACRES
- 190 Lokeys Ln
- 303 Ron Dr
- 0 Tanners Bridge Rd Unit 10588144
- 637 Sleeping Meadow Ln
- 209 Angie Way
- 763 Moss Side Dr
- 758 Clarence Edwards Rd
- 1129 Loganville Hwy
- 286 Meadows Dr
- 1071 Covenant Ct
- 1111 Otis Dr
- 103 Camp Ct
- 384 Winslow Ct
- 1024 Lyndhurst Ln
- 1164 Otis Dr
- 575 Mackinaw Dr
- 1161 Locust Dr Unit 3C
- 1165 Locust Dr Unit 4C
- 1165 Locust Dr
- 1159 Locust Dr
- 1159 Locust Dr
- 1159 Locust Dr Unit 3
- 987 Camellia Ct
- 1167 Locust Dr Unit 5C
- 1167 Locust Dr Unit 3
- 1162 Locust Dr Unit 3
- 541 Pin Oak Dr Unit 1C
- 541 Pin Oak Dr
- 537 Pin Oak Dr Unit 24C
- 537 Pin Oak Dr
- 985 Camellia Ct Unit 10C
- 985 Camellia Ct
- 1160 Locust Dr
- 1160 Locust Dr Unit 3
- 111 Trail Winds Dr
- 56 Hargrave Ave