D
Seller's Agent in 2012
David Green
Avripas Southern Real Estate
(618) 923-1111
75 Total Sales

Estimated Value: $80,000 - $180,000
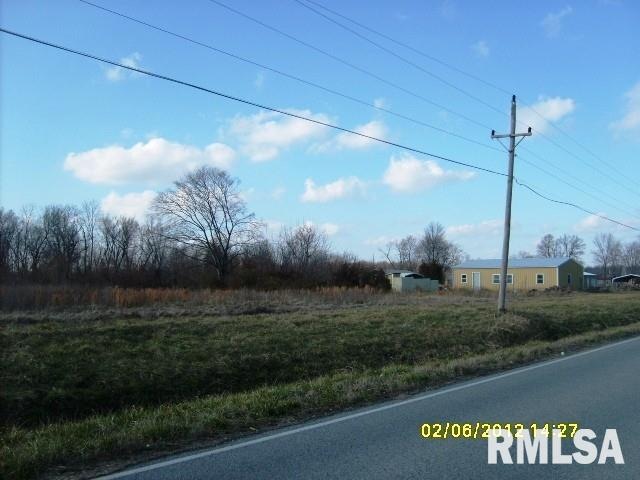
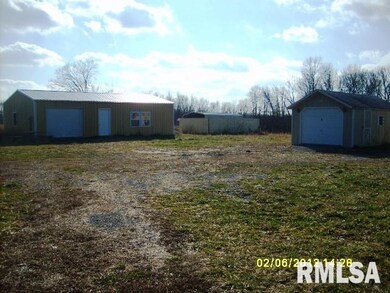
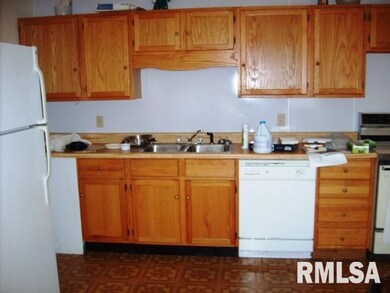
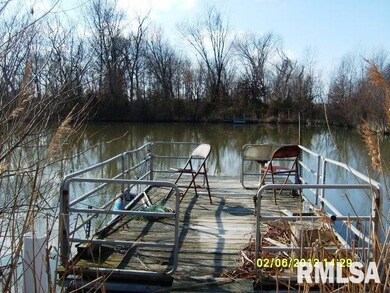
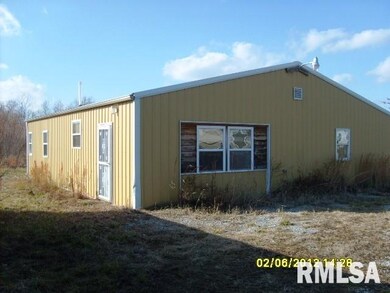
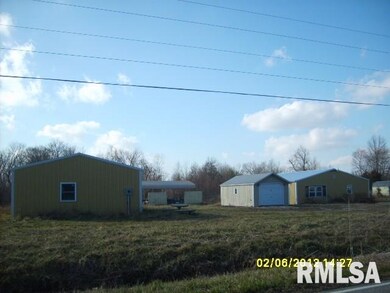
LARGE PARCEL WITH QUITE A BIT TO OFFER. THIS PROPERTY INCLUDES TWO POLE BARNS ONE HAS A DWELLING WITH 5 ROOMS FULL BATH WITH ELECTRIC BASEBOARD HEAT WITH A POOL TABLE. THERE IS A LARGE STOCKED POND THAT INCLUDES A BOAT & FLOATING DOCK.
Last Agent to Sell the Property
Avripas Southern Real Estate License #475129934 Listed on: 02/06/2012
Property Type
Est. Annual Taxes
Lot Details
Utilities
| Date | Event | Price | Change | Sq Ft Price |
|---|---|---|---|---|
| 05/04/2012 05/04/12 | Sold | $65,000 | -9.7% | -- |
| 04/04/2012 04/04/12 | Pending | -- | -- | -- |
| 02/06/2012 02/06/12 | For Sale | $72,000 | -- | -- |
| Year | Tax Paid | Tax Assessment Tax Assessment Total Assessment is a certain percentage of the fair market value that is determined by local assessors to be the total taxable value of land and additions on the property. | Land | Improvement |
|---|---|---|---|---|
| 2023 | $1,587 | $30,950 | $4,150 | $26,800 |
| 2022 | $1,451 | $27,885 | $3,740 | $24,145 |
| 2021 | $1,396 | $26,310 | $3,530 | $22,780 |
| 2020 | $1,331 | $25,475 | $3,420 | $22,055 |
| 2019 | $1,268 | $25,535 | $3,430 | $22,105 |
| 2018 | $1,189 | $25,035 | $3,365 | $21,670 |
| 2017 | $1,170 | $24,540 | $3,300 | $21,240 |
| 2016 | $1,124 | $24,215 | $3,255 | $20,960 |
| 2015 | $1,044 | $24,215 | $3,255 | $20,960 |
| 2014 | $1,142 | $23,250 | $3,125 | $20,125 |
| 2013 | $1,459 | $20,945 | $2,815 | $18,130 |
D
Seller's Agent in 2012
David Green
Avripas Southern Real Estate
(618) 923-1111
75 Total Sales

Buyer's Agent in 2012
Lynnette Hunter
HUNTER REAL ESTATE
(618) 438-0414
68 Total Sales
Source: RMLS Alliance
MLS Number: RMAEB308683
APN: 11-27-400-013
Disclaimer: Certain information contained herein is derived from information provided by parties other than Homes.com. All information provided is deemed reliable, but is not guaranteed to be accurate and should be independently verified.
![]() IDX information is provided exclusively for personal, non-commercial use, and may not be used for any purpose other than to identify prospective properties consumers may be interested in purchasing. Information is deemed reliable but not guaranteed.
IDX information is provided exclusively for personal, non-commercial use, and may not be used for any purpose other than to identify prospective properties consumers may be interested in purchasing. Information is deemed reliable but not guaranteed.