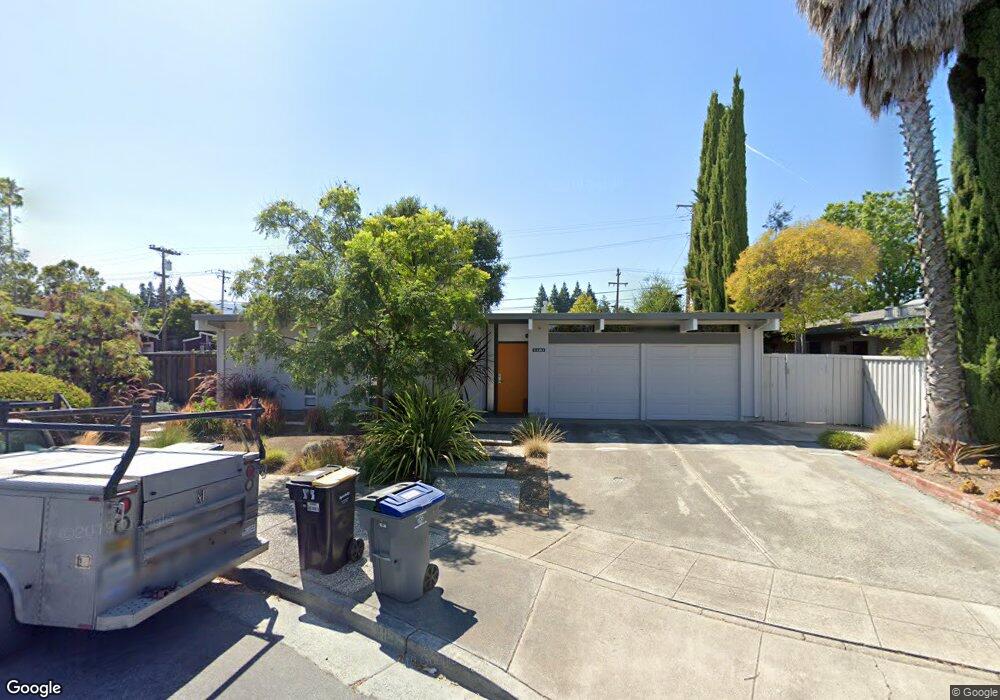
1161 Regia Ct Sunnyvale, CA 94087
Estimated Value: $2,631,000 - $2,848,000
4
Beds
2
Baths
1,755
Sq Ft
$1,562/Sq Ft
Est. Value
About This Home
This home is located at 1161 Regia Ct, Sunnyvale, CA 94087 and is currently estimated at $2,741,695, approximately $1,562 per square foot. 1161 Regia Ct is a home located in Santa Clara County with nearby schools including Cumberland Elementary School, Sunnyvale Middle School, and Fremont High School.
Ownership History
Date
Name
Owned For
Owner Type
Purchase Details
Closed on
Apr 11, 2017
Sold by
Centazzo Alessio and Centazzo Sabina
Bought by
Centazzo Alessio and Centazzo Sabina
Current Estimated Value
Purchase Details
Closed on
Sep 10, 2010
Sold by
Hansen Robert L and Hansen Anita J
Bought by
Centazzo Alessio and Centazzo Sabina
Home Financials for this Owner
Home Financials are based on the most recent Mortgage that was taken out on this home.
Original Mortgage
$250,000
Outstanding Balance
$157,034
Interest Rate
3.5%
Mortgage Type
New Conventional
Estimated Equity
$2,584,661
Purchase Details
Closed on
Dec 19, 2005
Sold by
Hansen Robert L and Hansen Anita J
Bought by
Hansen Robert L and Hansen Anita J
Purchase Details
Closed on
Nov 6, 1996
Sold by
Vierra Frisch Renee A
Bought by
Hansen Robert L and Hansen Anita J
Home Financials for this Owner
Home Financials are based on the most recent Mortgage that was taken out on this home.
Original Mortgage
$207,000
Interest Rate
7.25%
Create a Home Valuation Report for This Property
The Home Valuation Report is an in-depth analysis detailing your home's value as well as a comparison with similar homes in the area
Home Values in the Area
Average Home Value in this Area
Purchase History
| Date | Buyer | Sale Price | Title Company |
|---|---|---|---|
| Centazzo Alessio | -- | None Available | |
| Centazzo Alessio | $900,000 | Cornerstone Title Company | |
| Hansen Robert L | -- | None Available | |
| Hansen Robert L | $379,000 | Old Republic Title Company |
Source: Public Records
Mortgage History
| Date | Status | Borrower | Loan Amount |
|---|---|---|---|
| Open | Centazzo Alessio | $250,000 | |
| Previous Owner | Hansen Robert L | $207,000 |
Source: Public Records
Tax History Compared to Growth
Tax History
| Year | Tax Paid | Tax Assessment Tax Assessment Total Assessment is a certain percentage of the fair market value that is determined by local assessors to be the total taxable value of land and additions on the property. | Land | Improvement |
|---|---|---|---|---|
| 2025 | $13,433 | $1,166,865 | $922,442 | $244,423 |
| 2024 | $13,433 | $1,143,986 | $904,355 | $239,631 |
| 2023 | $13,277 | $1,121,556 | $886,623 | $234,933 |
| 2022 | $13,024 | $1,099,566 | $869,239 | $230,327 |
| 2021 | $12,892 | $1,078,007 | $852,196 | $225,811 |
| 2020 | $12,729 | $1,066,954 | $843,458 | $223,496 |
| 2019 | $12,445 | $1,046,034 | $826,920 | $219,114 |
| 2018 | $12,198 | $1,025,524 | $810,706 | $214,818 |
| 2017 | $11,960 | $1,005,416 | $794,810 | $210,606 |
| 2016 | $11,467 | $985,703 | $779,226 | $206,477 |
| 2015 | $11,535 | $970,898 | $767,522 | $203,376 |
| 2014 | $11,306 | $951,881 | $752,488 | $199,393 |
Source: Public Records
Map
Nearby Homes
- 725 Winstead Terrace
- 1140 Snowberry Ct
- 839 Springfield Terrace
- 654 Princeton Dr
- 1243 E Fremont Terrace
- 1308 Yarmouth Terrace
- 532 Cashmere Ct
- Plan 7 at Vida
- Plan 4 at Vida
- Plan 2 at Vida
- Plan 8 at Vida
- Plan 1 at Vida
- Plan 3 at Vida
- Plan 5 at Vida
- Plan 6 at Vida
- 1304 Barbet Cir Unit 6
- 1304 Barbet Cir Unit 1
- 1303 Besra Terrace Unit 2
- 1303 Besra Terrace Unit 5
- 1303 Besra Terrace Unit 13
- 1157 Regia Ct
- 1165 Regia Ct
- 1180 Hollenbeck Ave
- 1186 Hollenbeck Ave
- 1176 Hollenbeck Ave
- 1168 Regia Ct
- 1192 Hollenbeck Ave
- 1160 Regia Ct
- 1156 Regia Ct
- 1164 Regia Ct
- 1191 Vanderbilt Ct W
- 1194 Hollenbeck Ave
- 689 Torrington Dr
- 695 Torrington Dr
- 1190 Vanderbilt Ct W
- 685 Torrington Dr
- 1195 Vanderbilt Ct W
- 699 Torrington Dr
- 1161 Ribier Ct
- 1165 Ribier Ct