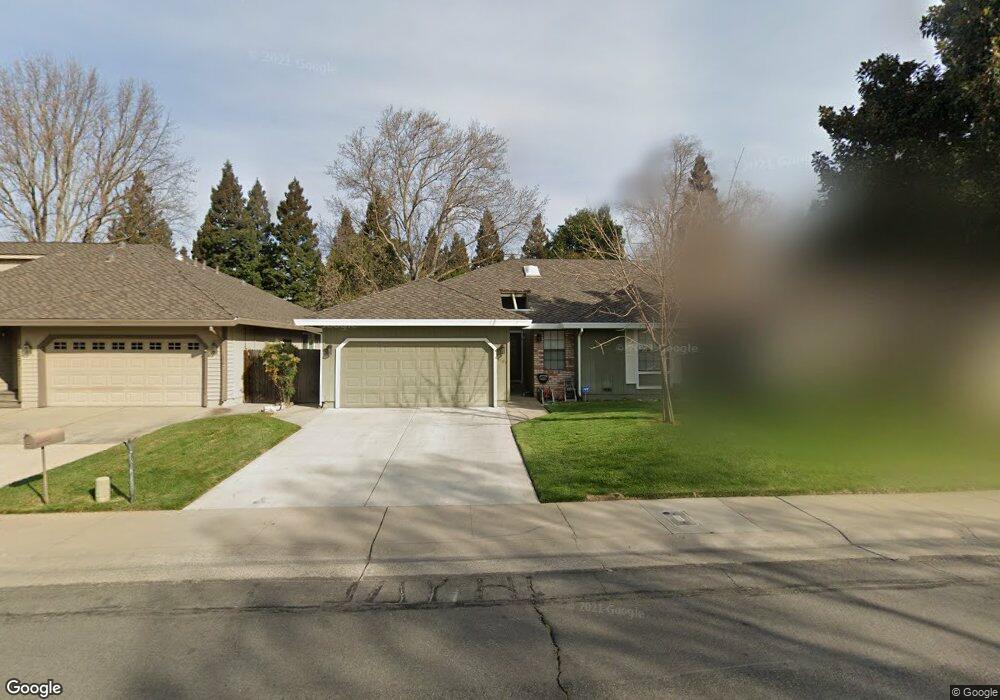
1161 Spruce Tree Cir Sacramento, CA 95831
Pocket-Greenhaven NeighborhoodEstimated Value: $503,000 - $529,000
3
Beds
2
Baths
1,632
Sq Ft
$319/Sq Ft
Est. Value
About This Home
This home is located at 1161 Spruce Tree Cir, Sacramento, CA 95831 and is currently estimated at $519,882, approximately $318 per square foot. 1161 Spruce Tree Cir is a home located in Sacramento County with nearby schools including Matsuyama Elementary School, Sam Brannan Middle School, and John F. Kennedy High School.
Ownership History
Date
Name
Owned For
Owner Type
Purchase Details
Closed on
May 26, 2015
Sold by
Poston Eloise M and Poston Trust
Bought by
Smith Nash Barbara J
Current Estimated Value
Home Financials for this Owner
Home Financials are based on the most recent Mortgage that was taken out on this home.
Original Mortgage
$261,182
Outstanding Balance
$206,872
Interest Rate
4.4%
Mortgage Type
FHA
Estimated Equity
$313,010
Purchase Details
Closed on
Feb 13, 2006
Sold by
Poston Eloise
Bought by
Poston Eloise M and Poston Trust
Purchase Details
Closed on
Nov 1, 2002
Sold by
Kelly Robert and Kelly Cheryl
Bought by
Poston Eloise
Home Financials for this Owner
Home Financials are based on the most recent Mortgage that was taken out on this home.
Original Mortgage
$215,100
Interest Rate
5.88%
Purchase Details
Closed on
Apr 21, 1998
Sold by
Kelly Robert L
Bought by
Kelly Robert and Kelly Cheryl
Create a Home Valuation Report for This Property
The Home Valuation Report is an in-depth analysis detailing your home's value as well as a comparison with similar homes in the area
Home Values in the Area
Average Home Value in this Area
Purchase History
| Date | Buyer | Sale Price | Title Company |
|---|---|---|---|
| Smith Nash Barbara J | $266,000 | Stewart Title | |
| Poston Eloise M | -- | None Available | |
| Poston Eloise | $239,000 | Chicago Title Company | |
| Kelly Robert | -- | -- |
Source: Public Records
Mortgage History
| Date | Status | Borrower | Loan Amount |
|---|---|---|---|
| Open | Smith Nash Barbara J | $261,182 | |
| Previous Owner | Poston Eloise | $215,100 |
Source: Public Records
Tax History Compared to Growth
Tax History
| Year | Tax Paid | Tax Assessment Tax Assessment Total Assessment is a certain percentage of the fair market value that is determined by local assessors to be the total taxable value of land and additions on the property. | Land | Improvement |
|---|---|---|---|---|
| 2025 | $3,937 | $319,682 | $96,143 | $223,539 |
| 2024 | $3,937 | $313,414 | $94,258 | $219,156 |
| 2023 | $3,837 | $307,269 | $92,410 | $214,859 |
| 2022 | $3,786 | $301,246 | $90,599 | $210,647 |
| 2021 | $3,604 | $295,340 | $88,823 | $206,517 |
| 2020 | $3,625 | $292,313 | $87,913 | $204,400 |
| 2019 | $3,548 | $286,583 | $86,190 | $200,393 |
| 2018 | $5,448 | $280,964 | $84,500 | $196,464 |
| 2017 | $3,404 | $275,456 | $82,844 | $192,612 |
| 2016 | $3,305 | $270,056 | $81,220 | $188,836 |
| 2015 | $2,676 | $208,671 | $74,213 | $134,458 |
| 2014 | $2,593 | $202,593 | $72,051 | $130,542 |
Source: Public Records
Map
Nearby Homes
- 1210 Cedar Tree Way
- 1053 L Aloutte Way
- 1100 La Fleur Way
- 7717 E Port Dr
- 7400 Mooncrest Way
- 7332 Idle Wild Way
- 943 Shore Breeze Dr
- 14 Morningsun Ct
- 7341 Stanwood Way
- 7701 Sleepy River Way
- 7518 Bowen Cir
- 1416 Lomas Way
- 977 Coleman Ranch Way
- 8055 Linda Isle Ln
- 7170 Westmoreland Way
- 7524 Schreiner St
- 7110 Westmoreland Way
- 1449 64th Ave
- 7048 13th St
- 7036 13th St
- 1157 Spruce Tree Cir
- 1153 Spruce Tree Cir
- 1167 Spruce Tree Cir
- 1162 Spruce Tree Cir
- 1164 Spruce Tree Cir
- 1158 Spruce Tree Cir
- 1171 Spruce Tree Cir
- 1149 Spruce Tree Cir
- 1168 Spruce Tree Cir
- 1136 Spruce Tree Cir
- 1175 Spruce Tree Cir
- 1141 Spruce Tree Cir
- 1155 Rose Tree Way
- 1176 Spruce Tree Cir
- 1159 Rose Tree Way
- 1151 Rose Tree Way
- 1137 Spruce Tree Cir
- 1163 Rose Tree Way
- 1132 Spruce Tree Cir
- 1179 Spruce Tree Cir