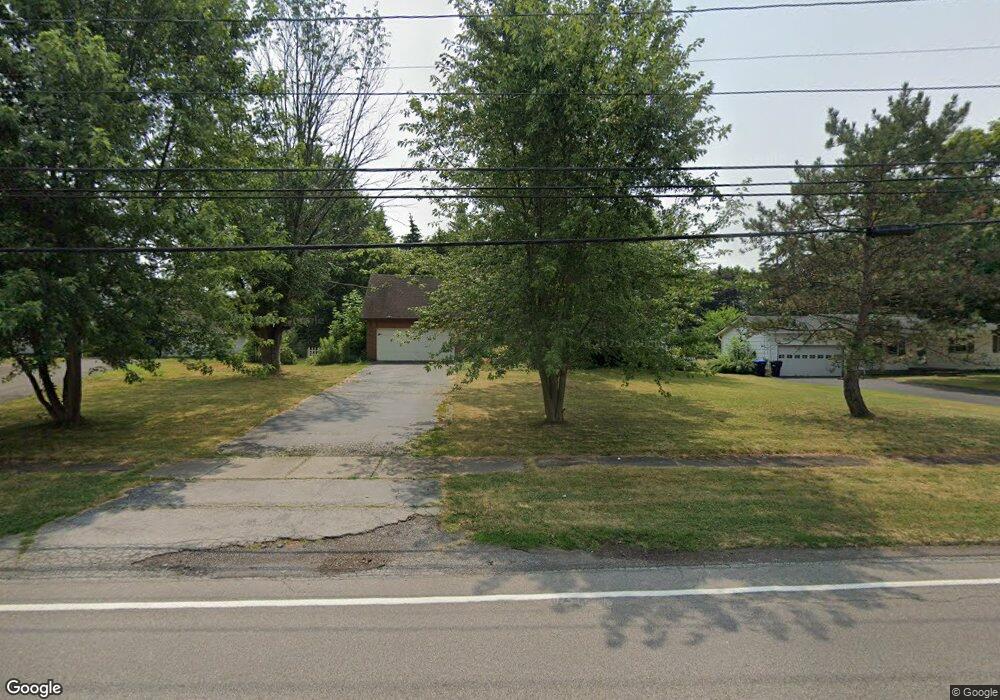
1161 Weiland Rd Rochester, NY 14626
Estimated Value: $278,000 - $299,000
3
Beds
3
Baths
1,708
Sq Ft
$171/Sq Ft
Est. Value
About This Home
This home is located at 1161 Weiland Rd, Rochester, NY 14626 and is currently estimated at $291,805, approximately $170 per square foot. 1161 Weiland Rd is a home located in Monroe County with nearby schools including Holmes Road Elementary School, Greece Community Early Learning Center, and Buckman Heights Elementary School.
Ownership History
Date
Name
Owned For
Owner Type
Purchase Details
Closed on
Jun 29, 2017
Sold by
Masceri Laura and Lemmey Laura
Bought by
Dugan Rodney and Dugan Sarah
Current Estimated Value
Home Financials for this Owner
Home Financials are based on the most recent Mortgage that was taken out on this home.
Original Mortgage
$157,102
Outstanding Balance
$132,211
Interest Rate
4.37%
Mortgage Type
FHA
Estimated Equity
$159,594
Purchase Details
Closed on
Oct 28, 2013
Sold by
Masceri Anthony J
Bought by
Masceri Laura
Purchase Details
Closed on
Sep 4, 2008
Sold by
Brown Taylor S and Brown Jennifer A
Bought by
Masceri Anthony J and Masceri Laura
Home Financials for this Owner
Home Financials are based on the most recent Mortgage that was taken out on this home.
Original Mortgage
$144,498
Interest Rate
6.54%
Mortgage Type
FHA
Purchase Details
Closed on
Aug 22, 2003
Sold by
Delmerico Richard
Bought by
Brown Taylor
Create a Home Valuation Report for This Property
The Home Valuation Report is an in-depth analysis detailing your home's value as well as a comparison with similar homes in the area
Home Values in the Area
Average Home Value in this Area
Purchase History
| Date | Buyer | Sale Price | Title Company |
|---|---|---|---|
| Dugan Rodney | $160,000 | None Available | |
| Masceri Laura | -- | None Available | |
| Masceri Anthony J | $146,000 | None Available | |
| Brown Taylor | $135,000 | Jim Grossman |
Source: Public Records
Mortgage History
| Date | Status | Borrower | Loan Amount |
|---|---|---|---|
| Open | Dugan Rodney | $157,102 | |
| Previous Owner | Masceri Anthony J | $144,498 |
Source: Public Records
Tax History Compared to Growth
Tax History
| Year | Tax Paid | Tax Assessment Tax Assessment Total Assessment is a certain percentage of the fair market value that is determined by local assessors to be the total taxable value of land and additions on the property. | Land | Improvement |
|---|---|---|---|---|
| 2024 | $7,568 | $153,100 | $34,200 | $118,900 |
| 2023 | $7,344 | $153,100 | $34,200 | $118,900 |
| 2022 | $7,703 | $160,000 | $38,000 | $122,000 |
| 2021 | $7,603 | $160,000 | $38,000 | $122,000 |
| 2020 | $7,315 | $155,000 | $38,000 | $117,000 |
| 2019 | $6,051 | $155,000 | $38,000 | $117,000 |
| 2018 | $7,415 | $155,000 | $38,000 | $117,000 |
| 2017 | $0 | $148,000 | $38,000 | $110,000 |
| 2016 | $6,051 | $148,000 | $38,000 | $110,000 |
| 2015 | -- | $148,000 | $38,000 | $110,000 |
| 2014 | -- | $146,000 | $38,000 | $108,000 |
Source: Public Records
Map
Nearby Homes
- 1124 Weiland Rd
- 26 Webwood Cir
- 106 Cobleskill Dr
- 29 Laurelwood Dr
- 848 Weiland Rd
- 186 Sannita Dr
- 478 Fox Meadow Rd
- 138 Stallion Cir
- 101 Woodedge Ln
- 67 Stallion Cir
- 362 Stone Fence Rd
- 25 Cherry Creek Ln
- 73 Alcott Rd
- 169 Straub Rd
- 61 Newton Rd
- 61 Calhoun Ave
- 109 Alcott Rd
- 96 Ridgecrest Rd
- 80 Auburn Ave
- 63 Rocmar Dr
- 1151 Weiland Rd
- 1171 Weiland Rd
- 55 Weiland Woods Ln
- 49 Weiland Woods Ln
- 63 Weiland Woods Ln
- 1146 Weiland Rd
- 1175 Weiland Rd
- 1189 Weiland Rd
- 1134 Weiland Rd
- 1178 Weiland Rd
- 1129 Weiland Rd
- 1217 Weiland Rd
- 1190 Weiland Rd
- 70 Weiland Woods Ln
- 250 Carmas Dr
- 242 Carmas Dr
- 71 Weiland Woods Ln
- 1112 Weiland Rd
- 234 Carmas Dr
- 22 Red Hickory Dr