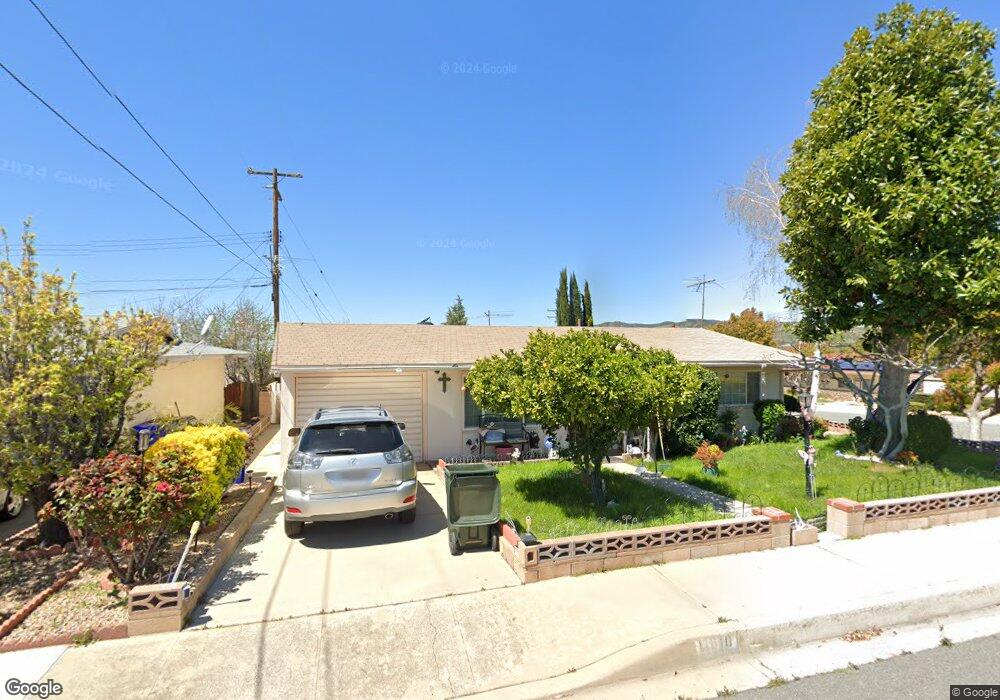
11610 Lennox St Yucaipa, CA 92399
Estimated Value: $335,000 - $349,000
2
Beds
2
Baths
1,071
Sq Ft
$320/Sq Ft
Est. Value
About This Home
This home is located at 11610 Lennox St, Yucaipa, CA 92399 and is currently estimated at $342,301, approximately $319 per square foot. 11610 Lennox St is a home located in San Bernardino County with nearby schools including Ridgeview Elementary School, Park View Middle School, and Yucaipa High School.
Ownership History
Date
Name
Owned For
Owner Type
Purchase Details
Closed on
Apr 13, 2009
Sold by
Clarke Kim C
Bought by
Clarke Kim C and Family Trust Of Kim C Clarke
Current Estimated Value
Purchase Details
Closed on
Aug 19, 1996
Sold by
Clarke Kim C
Bought by
Clarke Kim C and Duran Myrtle B
Home Financials for this Owner
Home Financials are based on the most recent Mortgage that was taken out on this home.
Original Mortgage
$56,953
Outstanding Balance
$4,096
Interest Rate
8.18%
Mortgage Type
FHA
Estimated Equity
$338,205
Purchase Details
Closed on
Aug 8, 1996
Sold by
Brink Jack R
Bought by
Brink Joyce D
Home Financials for this Owner
Home Financials are based on the most recent Mortgage that was taken out on this home.
Original Mortgage
$56,953
Outstanding Balance
$4,096
Interest Rate
8.18%
Mortgage Type
FHA
Estimated Equity
$338,205
Purchase Details
Closed on
Jul 25, 1996
Sold by
Day Alice D and Day Joyce D
Bought by
Clarke Kim C
Home Financials for this Owner
Home Financials are based on the most recent Mortgage that was taken out on this home.
Original Mortgage
$56,953
Outstanding Balance
$4,096
Interest Rate
8.18%
Mortgage Type
FHA
Estimated Equity
$338,205
Purchase Details
Closed on
Mar 13, 1996
Sold by
Day Alice D
Bought by
Day Alice D and Brink Joyce D
Create a Home Valuation Report for This Property
The Home Valuation Report is an in-depth analysis detailing your home's value as well as a comparison with similar homes in the area
Home Values in the Area
Average Home Value in this Area
Purchase History
| Date | Buyer | Sale Price | Title Company |
|---|---|---|---|
| Clarke Kim C | -- | None Available | |
| Clarke Kim C | -- | Chicago Title Co | |
| Brink Joyce D | -- | Stewart Title | |
| Clarke Kim C | $57,000 | Stewart Title | |
| Day Alice D | -- | -- |
Source: Public Records
Mortgage History
| Date | Status | Borrower | Loan Amount |
|---|---|---|---|
| Open | Clarke Kim C | $56,953 |
Source: Public Records
Tax History Compared to Growth
Tax History
| Year | Tax Paid | Tax Assessment Tax Assessment Total Assessment is a certain percentage of the fair market value that is determined by local assessors to be the total taxable value of land and additions on the property. | Land | Improvement |
|---|---|---|---|---|
| 2025 | $1,405 | $92,835 | $24,431 | $68,404 |
| 2024 | $1,405 | $91,015 | $23,952 | $67,063 |
| 2023 | $1,330 | $89,230 | $23,482 | $65,748 |
| 2022 | $1,293 | $87,481 | $23,022 | $64,459 |
| 2021 | $1,263 | $85,766 | $22,571 | $63,195 |
| 2020 | $1,259 | $84,887 | $22,340 | $62,547 |
| 2019 | $1,204 | $83,223 | $21,902 | $61,321 |
| 2018 | $948 | $81,592 | $21,473 | $60,119 |
| 2017 | $927 | $79,992 | $21,052 | $58,940 |
| 2016 | $913 | $78,423 | $20,639 | $57,784 |
| 2015 | $903 | $77,245 | $20,329 | $56,916 |
| 2014 | $884 | $75,732 | $19,931 | $55,801 |
Source: Public Records
Map
Nearby Homes
- 11610 Dodd St
- 35345 Panorama Dr
- 11744 Auburn Ct
- 11748 Douglas St
- 11570 Bryant St
- 35610 Panorama Dr
- 11775 Auburn Ave
- 35688 Date St
- 9813 Fremont St
- 11740 Grant St
- 35054 Persimmon Ave
- 35263 Beech Ave
- 35483 Acacia Ave
- 12040 Sutter Ave
- 34942 S Serrano Square
- 35225 Acacia Ave
- 35488 Schafer Ranch Rd
- 12049 California St
- 0 Pendleton Unit SW24186609
- 11050 Bryant St Unit 78
- 11620 Lennox St
- 11609 Madison St
- 11619 Madison St
- 11630 Lennox St
- 11609 Lennox St
- 11619 Lennox St
- 35466 Panorama Dr
- 11629 Madison St
- 11629 Lennox St
- 11640 Lennox St
- 11639 Madison St
- 11610 Verona St
- 11620 Verona St
- 35472 Panorama Dr
- 11650 Lennox St
- 11630 Verona St
- 35436 Panorama Dr
- 11606 Madison St
- 11616 Madison St
- 35488 Panorama Dr