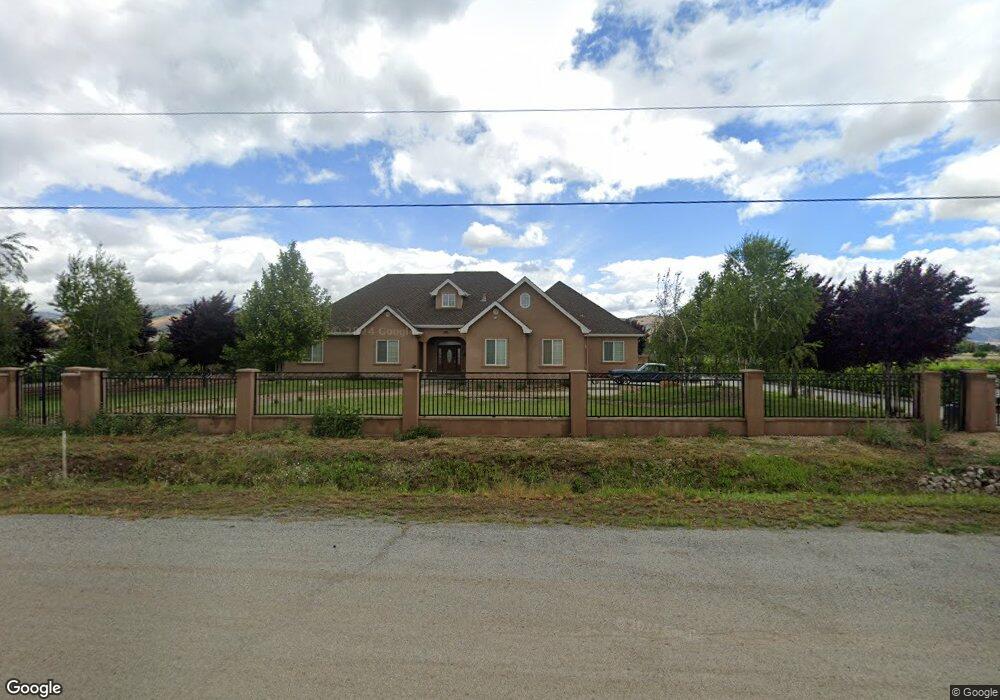
11610 Murphy Ave San Martin, CA 95046
Estimated Value: $1,620,000 - $1,858,000
4
Beds
3
Baths
2,905
Sq Ft
$596/Sq Ft
Est. Value
About This Home
This home is located at 11610 Murphy Ave, San Martin, CA 95046 and is currently estimated at $1,732,490, approximately $596 per square foot. 11610 Murphy Ave is a home located in Santa Clara County with nearby schools including Rucker Elementary School, Solorsano Middle School, and Christopher High School.
Ownership History
Date
Name
Owned For
Owner Type
Purchase Details
Closed on
Mar 4, 2021
Sold by
Maria Haro and Maria Rosa
Bought by
G & Rm Haro Real Family Trust
Current Estimated Value
Purchase Details
Closed on
Jun 16, 2004
Sold by
Conrique Kathleen
Bought by
Haro Gilberto and Delreal Rosamaria
Home Financials for this Owner
Home Financials are based on the most recent Mortgage that was taken out on this home.
Original Mortgage
$250,000
Interest Rate
6.25%
Mortgage Type
Purchase Money Mortgage
Purchase Details
Closed on
Jun 10, 2004
Sold by
Donahue Patrick G and Donahue Helene B
Bought by
Conrique Kathleen
Home Financials for this Owner
Home Financials are based on the most recent Mortgage that was taken out on this home.
Original Mortgage
$250,000
Interest Rate
6.25%
Mortgage Type
Purchase Money Mortgage
Create a Home Valuation Report for This Property
The Home Valuation Report is an in-depth analysis detailing your home's value as well as a comparison with similar homes in the area
Home Values in the Area
Average Home Value in this Area
Purchase History
| Date | Buyer | Sale Price | Title Company |
|---|---|---|---|
| G & Rm Haro Real Family Trust | -- | None Listed On Document | |
| Haro Gilberto | $417,500 | Alliance Title Company | |
| Conrique Kathleen | -- | Alliance Title Company |
Source: Public Records
Mortgage History
| Date | Status | Borrower | Loan Amount |
|---|---|---|---|
| Previous Owner | Haro Gilberto | $250,000 |
Source: Public Records
Tax History Compared to Growth
Tax History
| Year | Tax Paid | Tax Assessment Tax Assessment Total Assessment is a certain percentage of the fair market value that is determined by local assessors to be the total taxable value of land and additions on the property. | Land | Improvement |
|---|---|---|---|---|
| 2025 | $14,123 | $1,181,502 | $581,951 | $599,551 |
| 2024 | $14,123 | $1,158,337 | $570,541 | $587,796 |
| 2023 | $14,020 | $1,135,625 | $559,354 | $576,271 |
| 2022 | $13,769 | $1,113,359 | $548,387 | $564,972 |
| 2021 | $13,706 | $1,091,530 | $537,635 | $553,895 |
| 2020 | $13,259 | $1,050,838 | $532,123 | $518,715 |
| 2019 | $12,249 | $960,361 | $521,690 | $438,671 |
| 2018 | $11,381 | $941,531 | $511,461 | $430,070 |
| 2017 | $11,623 | $923,071 | $501,433 | $421,638 |
| 2016 | $11,387 | $904,972 | $491,601 | $413,371 |
| 2015 | $10,717 | $891,379 | $484,217 | $407,162 |
| 2014 | $10,588 | $873,919 | $474,732 | $399,187 |
Source: Public Records
Map
Nearby Homes
- 310 Lena Ave
- 145 Masten Ave
- 12320 Highland Estates Ln
- 12315 Harding Ave
- 1830 Church Ave
- 1955 Church Ave
- 1925 Church Ave
- 0 W San Martin Ave
- 12645 Harding Ave
- 12755 Santa Teresa Blvd
- 905 E San Martin Ave
- 0 Buena Vista Ave
- 1322 Lions Peak Ln
- 1265 Lions Peak Ln
- 1405 Lakeview Ct
- 0002 Buena Vista Ave
- 10980 New Ave
- 13705 Sycamore Ave
- 13640 Sycamore Ave
- 1305 Lions Peak Ln