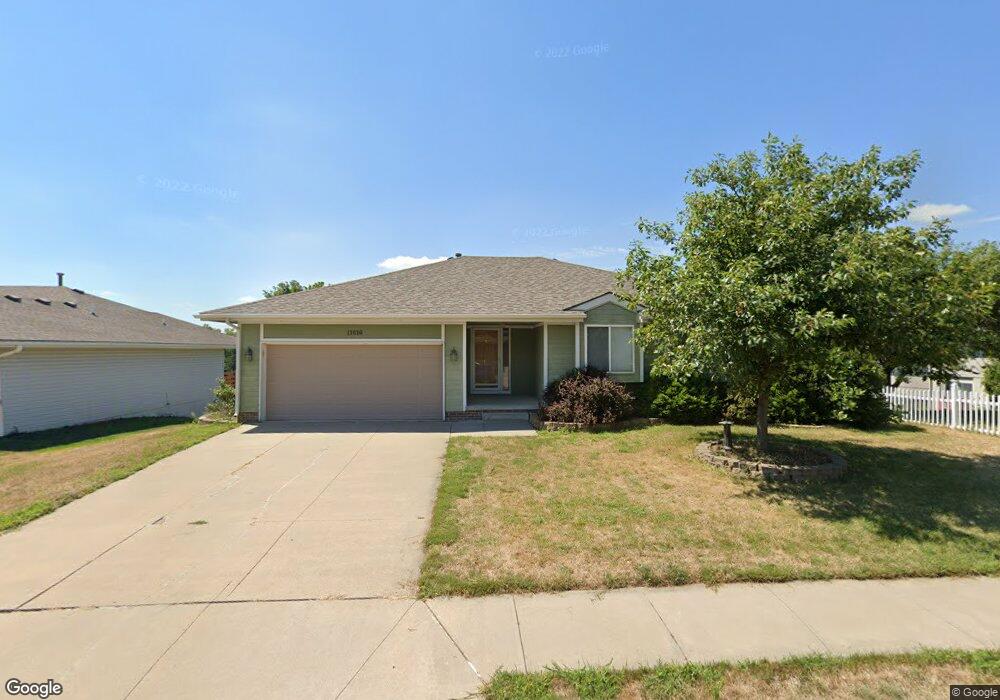
11616 S 205th St Gretna, NE 68028
Estimated Value: $343,000 - $381,665
3
Beds
3
Baths
2,619
Sq Ft
$140/Sq Ft
Est. Value
About This Home
This home is located at 11616 S 205th St, Gretna, NE 68028 and is currently estimated at $365,916, approximately $139 per square foot. 11616 S 205th St is a home located in Sarpy County with nearby schools including Squire John Thomas Elementary School, Gretna Middle School, and Gretna High School.
Ownership History
Date
Name
Owned For
Owner Type
Purchase Details
Closed on
Oct 21, 2011
Sold by
Lindbloom Charles E and Lindbloom Kindra A
Bought by
Blum Douglas Edward
Current Estimated Value
Purchase Details
Closed on
Feb 18, 2010
Sold by
Stine Andrew D
Bought by
Lindbloom Charles E and Lindbloom Kindra A
Home Financials for this Owner
Home Financials are based on the most recent Mortgage that was taken out on this home.
Original Mortgage
$140,000
Interest Rate
4.98%
Purchase Details
Closed on
Aug 15, 2001
Sold by
Melvin Sudbeck Homes Inc
Bought by
Stine Andrew D
Home Financials for this Owner
Home Financials are based on the most recent Mortgage that was taken out on this home.
Original Mortgage
$137,400
Interest Rate
6.96%
Create a Home Valuation Report for This Property
The Home Valuation Report is an in-depth analysis detailing your home's value as well as a comparison with similar homes in the area
Home Values in the Area
Average Home Value in this Area
Purchase History
| Date | Buyer | Sale Price | Title Company |
|---|---|---|---|
| Blum Douglas Edward | $166,000 | Omaha Title & Escrow Inc | |
| Lindbloom Charles E | $175,000 | Dakota Title & Escrow | |
| Stine Andrew D | $142,000 | Dakota Title & Escrow Co |
Source: Public Records
Mortgage History
| Date | Status | Borrower | Loan Amount |
|---|---|---|---|
| Previous Owner | Lindbloom Charles E | $140,000 | |
| Previous Owner | Stine Andrew D | $137,400 |
Source: Public Records
Tax History Compared to Growth
Tax History
| Year | Tax Paid | Tax Assessment Tax Assessment Total Assessment is a certain percentage of the fair market value that is determined by local assessors to be the total taxable value of land and additions on the property. | Land | Improvement |
|---|---|---|---|---|
| 2025 | $6,173 | $357,635 | $48,000 | $309,635 |
| 2024 | $6,817 | $345,128 | $47,000 | $298,128 |
| 2023 | $6,817 | $317,175 | $42,000 | $275,175 |
| 2022 | $6,357 | $278,565 | $38,000 | $240,565 |
| 2021 | $5,854 | $259,429 | $38,000 | $221,429 |
| 2020 | $5,586 | $249,000 | $33,000 | $216,000 |
| 2019 | $5,153 | $229,960 | $33,000 | $196,960 |
| 2018 | $4,948 | $221,813 | $27,000 | $194,813 |
| 2017 | $4,569 | $204,573 | $27,000 | $177,573 |
| 2016 | $4,256 | $191,048 | $24,000 | $167,048 |
| 2015 | $4,144 | $187,612 | $24,000 | $163,612 |
| 2014 | $4,067 | $185,704 | $24,000 | $161,704 |
| 2012 | -- | $183,426 | $24,000 | $159,426 |
Source: Public Records
Map
Nearby Homes
- 20717 Frances St
- 11647 Willow Park Dr
- 434 Devonshire Dr
- 11719 S 203rd St
- 206 E Westplains Rd
- 20919 Birch St
- 19905 Maple St
- 19819 Sherwood Cir
- 20926 Oak St
- 19910 Oak St
- 22111 Hackberry Dr
- 326 Connor St
- Lot 1 Silver Oaks Estates
- Lot 12 Silver Oaks Estates
- 21714 Hackberry Dr
- LOT 12 Gruenther Ridge
- 347 Michael Dr
- 419 Highland Dr
- 20605 Woodridge Dr
- Lot 80 Magnolia
- 11624 S 205th St
- 11583 S 206th St
- 11587 S 206th St
- 11607 S 206th St
- 11615 S 206th St
- 11621 S 206th St
- 11617 S 205th St
- 11611 S 205th St
- 11625 S 205th St
- 11603 S 205th St
- 20525 Frances St
- 20555 Frances St
- 20501 Frances St
- 20575 Frances St
- 11593 S 205th St
- 11582 S 206th St
- 12102 S 206th St
- 11586 S 206th St
- 20473 Frances St
- 11598 S 206th St