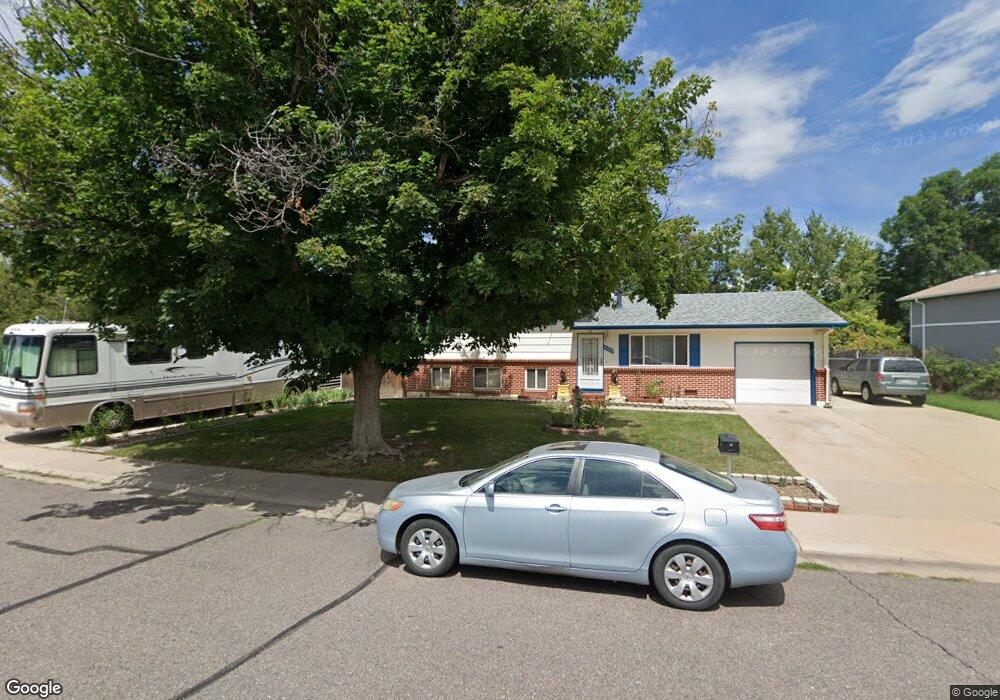
11619 E Walsh Place Aurora, CO 80012
Expo Park NeighborhoodEstimated Value: $421,536 - $456,000
4
Beds
3
Baths
1,040
Sq Ft
$419/Sq Ft
Est. Value
About This Home
This home is located at 11619 E Walsh Place, Aurora, CO 80012 and is currently estimated at $435,384, approximately $418 per square foot. 11619 E Walsh Place is a home located in Arapahoe County with nearby schools including Highline Community Elementary School, Prairie Middle School, and Overland High School.
Ownership History
Date
Name
Owned For
Owner Type
Purchase Details
Closed on
Jan 7, 2003
Sold by
Huynh Cuong and Huynh Quang C
Bought by
Huynh Linh T and Huynh Huong T
Current Estimated Value
Purchase Details
Closed on
Sep 20, 2002
Sold by
Huynh Cuong and Huynh Quang C
Bought by
Huynh Linh T and Huynh Huong T
Purchase Details
Closed on
Jan 22, 2002
Sold by
Huynh Quang C and Huynh Mandy
Bought by
Huynh Cuong and Huynh Quang C
Purchase Details
Closed on
Sep 19, 2001
Sold by
Huynh Quang C and Huynh Cuong
Bought by
Huynh Quang C and Huynh Mandy
Home Financials for this Owner
Home Financials are based on the most recent Mortgage that was taken out on this home.
Original Mortgage
$76,000
Interest Rate
6.85%
Purchase Details
Closed on
Jul 29, 1993
Sold by
Conversion Arapco
Bought by
Huynh Cuong Huynh Quang C
Purchase Details
Closed on
Dec 1, 1977
Sold by
Conversion Arapco
Bought by
Conversion Arapco
Purchase Details
Closed on
Jul 4, 1776
Bought by
Conversion Arapco
Create a Home Valuation Report for This Property
The Home Valuation Report is an in-depth analysis detailing your home's value as well as a comparison with similar homes in the area
Home Values in the Area
Average Home Value in this Area
Purchase History
| Date | Buyer | Sale Price | Title Company |
|---|---|---|---|
| Huynh Linh T | -- | -- | |
| Huynh Linh T | -- | -- | |
| Huynh Cuong | -- | -- | |
| Huynh Quang C | -- | First American Heritage Titl | |
| Huynh Cuong Huynh Quang C | -- | -- | |
| Conversion Arapco | -- | -- | |
| Conversion Arapco | -- | -- |
Source: Public Records
Mortgage History
| Date | Status | Borrower | Loan Amount |
|---|---|---|---|
| Closed | Huynh Quang C | $76,000 |
Source: Public Records
Tax History
| Year | Tax Paid | Tax Assessment Tax Assessment Total Assessment is a certain percentage of the fair market value that is determined by local assessors to be the total taxable value of land and additions on the property. | Land | Improvement |
|---|---|---|---|---|
| 2025 | $2,361 | $28,400 | -- | -- |
| 2024 | $2,082 | $30,096 | -- | -- |
| 2023 | $2,082 | $30,096 | $0 | $0 |
| 2022 | $1,636 | $22,581 | $0 | $0 |
| 2021 | $1,646 | $22,581 | $0 | $0 |
| 2020 | $1,661 | $23,124 | $0 | $0 |
| 2019 | $1,602 | $23,124 | $0 | $0 |
| 2018 | $1,417 | $19,224 | $0 | $0 |
| 2017 | $1,397 | $19,224 | $0 | $0 |
| 2016 | $1,244 | $16,055 | $0 | $0 |
| 2015 | $1,184 | $16,055 | $0 | $0 |
| 2014 | -- | $9,536 | $0 | $0 |
| 2013 | -- | $11,650 | $0 | $0 |
Source: Public Records
Map
Nearby Homes
- 809 S Nome St
- 841 S Oakland St
- 711 S Moline St
- 906 S Moline St
- 11951 E Kepner Dr
- 1011 S Nile Way
- 11955 E Ford Dr
- 922 S Paris Ct
- 628 S Oswego Ct
- 12055 E Tennessee Ave
- 912 S Peoria St
- 1090 S Newark St
- 11623 E Virginia Dr
- 932 S Peoria St Unit 932
- 12012 E Hoye Dr
- 12170 E Kepner Place Unit 12170
- 990 S Kenton St
- 12244 E Kentucky Ave
- 12434 E Tennessee Cir Unit B
- 12404 E Tennessee Cir Unit F
- 11609 E Walsh Place
- 11629 E Walsh Place
- 11639 E Walsh Place
- 736 S Nile Way
- 11610 E Walsh Place
- 11620 E Walsh Place
- 11600 E Walsh Place
- 11630 E Walsh Place
- 747 S Nome St
- 11649 E Walsh Place
- 735 S Nile Way
- 737 S Nome St
- 726 S Nile Way
- 745 S Nile Way
- 757 S Nome St
- 725 S Nile Way
- 11579 E Ada Place
- 766 S Nile Way
- 11569 E Ada Place
- 727 S Nome St
Your Personal Tour Guide
Ask me questions while you tour the home.