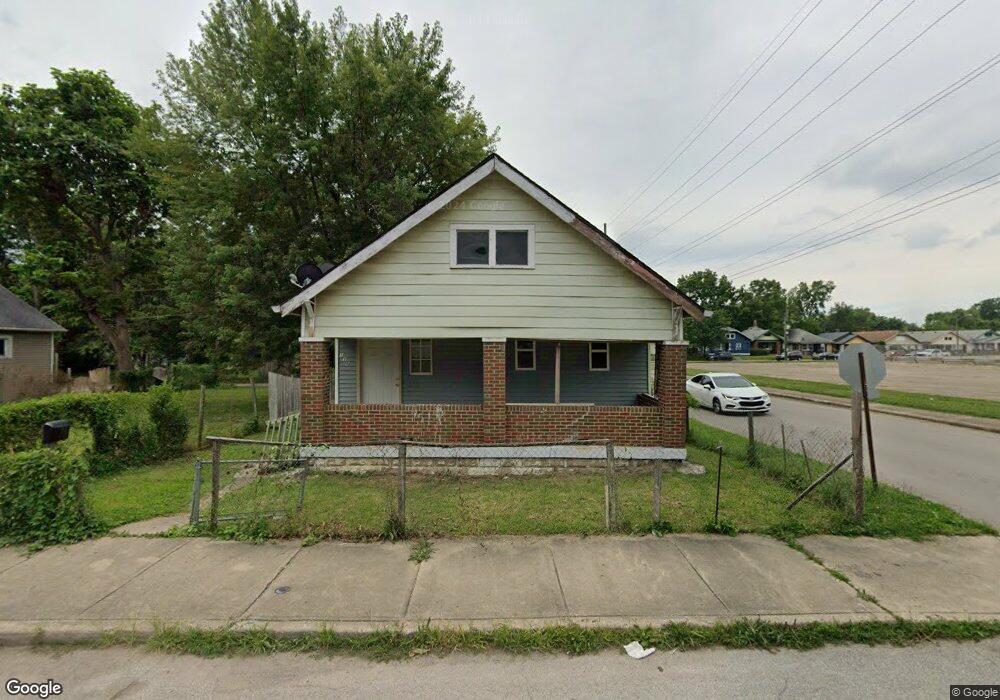
1162 N Mount St Indianapolis, IN 46222
Haughville NeighborhoodEstimated Value: $77,000 - $119,000
2
Beds
1
Bath
1,728
Sq Ft
$59/Sq Ft
Est. Value
About This Home
This home is located at 1162 N Mount St, Indianapolis, IN 46222 and is currently estimated at $101,245, approximately $58 per square foot. 1162 N Mount St is a home located in Marion County with nearby schools including Carl Wilde School 79, Lew Wallace School 107, and James Whitcomb Riley School 43.
Ownership History
Date
Name
Owned For
Owner Type
Purchase Details
Closed on
Jan 12, 2018
Sold by
Welcome Residentes Llc
Bought by
Rosas Juan C
Current Estimated Value
Purchase Details
Closed on
Aug 18, 2012
Bought by
Rosas Juan C
Purchase Details
Closed on
Jul 18, 2012
Sold by
New Day Residential Development Inc
Bought by
Welcome Residentes Llc
Purchase Details
Closed on
Jul 17, 2012
Sold by
City Of Indianapolis Department Of Metro
Bought by
New Day Residential Development
Purchase Details
Closed on
Jan 20, 2011
Sold by
Johnson Lee & Powe & Smith Investments L
Bought by
City Of Indianapolis
Purchase Details
Closed on
Aug 1, 2005
Sold by
Smith Gregory Ivry
Bought by
Johnson Lee Powe And Smith Investments L
Purchase Details
Closed on
Apr 20, 2005
Sold by
Zarate Pedro
Bought by
Smith Gregory Ivry
Home Financials for this Owner
Home Financials are based on the most recent Mortgage that was taken out on this home.
Original Mortgage
$48,450
Interest Rate
8.75%
Mortgage Type
Adjustable Rate Mortgage/ARM
Create a Home Valuation Report for This Property
The Home Valuation Report is an in-depth analysis detailing your home's value as well as a comparison with similar homes in the area
Home Values in the Area
Average Home Value in this Area
Purchase History
| Date | Buyer | Sale Price | Title Company |
|---|---|---|---|
| Rosas Juan C | -- | -- | |
| Rosas Juan C | $55,000 | -- | |
| Welcome Residentes Llc | -- | None Available | |
| New Day Residential Development | $1,000 | None Available | |
| City Of Indianapolis | $12,778 | None Available | |
| Johnson Lee Powe And Smith Investments L | -- | None Available | |
| Smith Gregory Ivry | -- | None Available |
Source: Public Records
Mortgage History
| Date | Status | Borrower | Loan Amount |
|---|---|---|---|
| Previous Owner | Smith Gregory Ivry | $48,450 |
Source: Public Records
Tax History Compared to Growth
Tax History
| Year | Tax Paid | Tax Assessment Tax Assessment Total Assessment is a certain percentage of the fair market value that is determined by local assessors to be the total taxable value of land and additions on the property. | Land | Improvement |
|---|---|---|---|---|
| 2024 | $532 | $19,600 | $2,900 | $16,700 |
| 2023 | $532 | $19,500 | $2,900 | $16,600 |
| 2022 | $493 | $18,000 | $2,900 | $15,100 |
| 2021 | $390 | $14,000 | $2,900 | $11,100 |
| 2020 | $251 | $8,000 | $2,900 | $5,100 |
| 2019 | $253 | $8,000 | $2,900 | $5,100 |
| 2018 | $242 | $7,500 | $2,900 | $4,600 |
| 2017 | $221 | $7,500 | $2,900 | $4,600 |
| 2016 | $206 | $7,000 | $2,900 | $4,100 |
| 2014 | $143 | $6,600 | $2,900 | $3,700 |
| 2013 | $135 | $6,500 | $2,900 | $3,600 |
Source: Public Records
Map
Nearby Homes
- 1056 N Mount St
- 1051 N Mount St
- 1135 N Holmes Ave
- 1129 N Pershing Ave
- 1405 N Mount St
- 1034 N Pershing Ave
- 955 N Belleview Place
- 1407 N Pershing Ave
- 1014 N Sheffield Ave
- 1205 Winfield Ave
- 974 N Sheffield Ave
- 1254 N Belmont Ave
- 958 N Sheffield Ave
- 1317 Sharon Ave
- 1325 Sharon Ave
- 1425 Sharon Ave
- 745 N Pershing Ave
- 1058 N Elder Ave
- 1143 N Elder Ave
- 1047 N Concord St
- 1204 N Mount St
- 1154 N Mount St
- 1161 N Belleview Place
- 1150 N Mount St
- 1155 N Belleview Place
- 1153 N Belleview Place
- 1146 N Mount St
- 1157 N Mount St
- 1149 N Belleview Place
- 1205 N Mount St
- 1153 N Mount St
- 1140 N Mount St
- 1209 N Mount St
- 1149 N Mount St
- 1141 N Belleview Place
- 1213 N Mount St
- 1145 N Mount St
- 1138 N Mount St
- 1164 N Belleview Place
- 1160 N Belleview Place