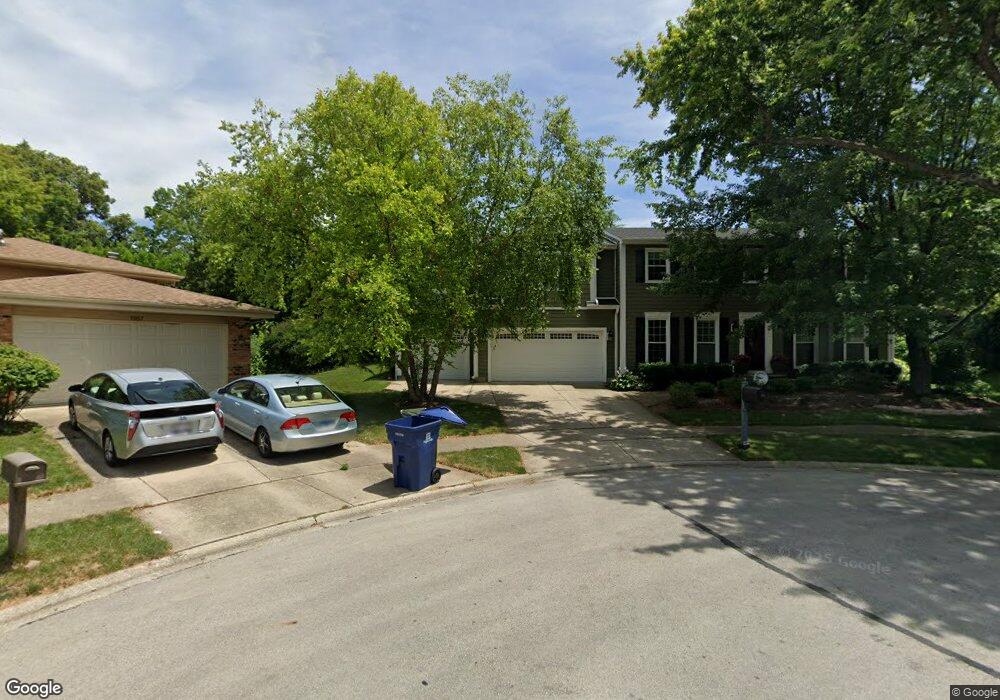
1162 Peachtree Ct Naperville, IL 60540
East Naperville NeighborhoodEstimated Value: $683,000 - $908,000
--
Bed
1
Bath
2,945
Sq Ft
$271/Sq Ft
Est. Value
About This Home
This home is located at 1162 Peachtree Ct, Naperville, IL 60540 and is currently estimated at $796,991, approximately $270 per square foot. 1162 Peachtree Ct is a home located in DuPage County with nearby schools including Highlands Elementary School, Kennedy Junior High School, and Naperville North High School.
Ownership History
Date
Name
Owned For
Owner Type
Purchase Details
Closed on
Jan 10, 2013
Sold by
Esler Brian E and Esler Annette L
Bought by
Esler Brian E and Esler Annette L
Current Estimated Value
Home Financials for this Owner
Home Financials are based on the most recent Mortgage that was taken out on this home.
Original Mortgage
$368,723
Outstanding Balance
$254,931
Interest Rate
3.25%
Mortgage Type
New Conventional
Estimated Equity
$542,060
Purchase Details
Closed on
Mar 5, 2001
Sold by
Veal Matthew A and Veal Kim M
Bought by
Esler Brian E and Ongaro Annette L
Home Financials for this Owner
Home Financials are based on the most recent Mortgage that was taken out on this home.
Original Mortgage
$275,000
Interest Rate
7.13%
Purchase Details
Closed on
Jul 31, 1997
Sold by
Stumpe Daniel J and Stume Becky A
Bought by
Veal Matthew A and Veal Kim M
Home Financials for this Owner
Home Financials are based on the most recent Mortgage that was taken out on this home.
Original Mortgage
$214,000
Interest Rate
7.12%
Create a Home Valuation Report for This Property
The Home Valuation Report is an in-depth analysis detailing your home's value as well as a comparison with similar homes in the area
Home Values in the Area
Average Home Value in this Area
Purchase History
| Date | Buyer | Sale Price | Title Company |
|---|---|---|---|
| Esler Brian E | -- | None Available | |
| Esler Brian E | $310,000 | Law Title Pick Up | |
| Veal Matthew A | $230,000 | -- |
Source: Public Records
Mortgage History
| Date | Status | Borrower | Loan Amount |
|---|---|---|---|
| Open | Esler Brian E | $368,723 | |
| Closed | Esler Brian E | $275,000 | |
| Previous Owner | Veal Matthew A | $214,000 |
Source: Public Records
Tax History Compared to Growth
Tax History
| Year | Tax Paid | Tax Assessment Tax Assessment Total Assessment is a certain percentage of the fair market value that is determined by local assessors to be the total taxable value of land and additions on the property. | Land | Improvement |
|---|---|---|---|---|
| 2024 | $13,287 | $224,893 | $80,896 | $143,997 |
| 2023 | $12,817 | $205,250 | $73,830 | $131,420 |
| 2022 | $12,523 | $199,500 | $71,760 | $127,740 |
| 2021 | $12,071 | $191,960 | $69,050 | $122,910 |
| 2020 | $11,816 | $188,510 | $67,810 | $120,700 |
| 2019 | $11,477 | $180,360 | $64,880 | $115,480 |
| 2018 | $10,671 | $169,040 | $60,810 | $108,230 |
| 2017 | $10,459 | $163,340 | $58,760 | $104,580 |
| 2016 | $9,117 | $157,450 | $56,640 | $100,810 |
| 2015 | $9,060 | $148,270 | $53,340 | $94,930 |
| 2014 | $8,464 | $134,000 | $48,490 | $85,510 |
| 2013 | $8,337 | $134,330 | $48,610 | $85,720 |
Source: Public Records
Map
Nearby Homes
- 1133 Catherine Ave
- 1068 Mattande Ln
- 212 Richard Rd
- 130 N Huffman St
- 915 E Chicago Ave
- 912 E Chicago Ave
- 1228 Elizabeth Ave
- 5 N Columbia St
- 203 S Columbia St
- 576 Springhill Cir
- 105 S Wright St
- 3 Westmoreland Ln
- 542 N Wright St
- 440 S Columbia St
- 25W257 Gunston Ave
- 32 Westmoreland Ln
- 825 Biltmore Ct
- 438 S Wright St
- 820 Prairie Ave
- 316 N Loomis St
- 1167 Peachtree Ct
- 1158 Peachtree Ct
- 1163 Peachtree Ct Unit 2
- 1154 Peachtree Ct
- 1159 Peachtree Ct
- 18 N Charles St
- 1150 Peachtree Ct
- 1158 Milburn Ct
- 1155 Peachtree Ct Unit 2
- 1162 Milburn Ct
- 14 N Charles St
- 1154 Milburn Ct
- 22 N Charles St
- 25W790 E Chicago Ave
- 1150 Milburn Ct
- 10 N Charles St
- 29 N Charles St
- 1167 Milburn Ct
- 25 N Charles St
- 33 N Charles St