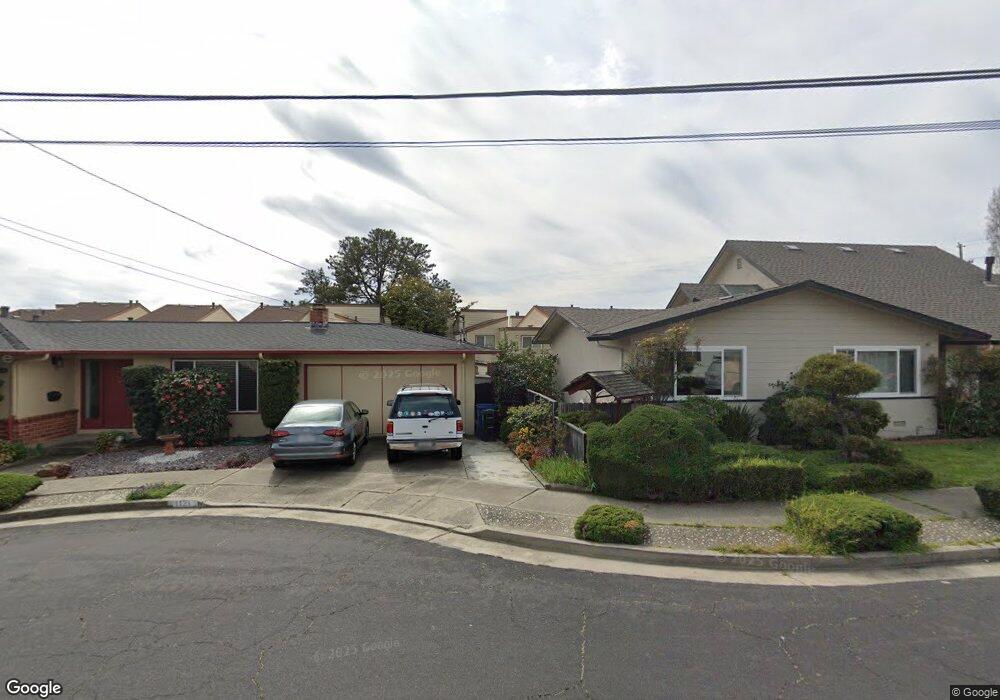
1162 Richmond St El Cerrito, CA 94530
Estimated Value: $637,000 - $706,000
3
Beds
3
Baths
1,353
Sq Ft
$495/Sq Ft
Est. Value
About This Home
This home is located at 1162 Richmond St, El Cerrito, CA 94530 and is currently estimated at $669,908, approximately $495 per square foot. 1162 Richmond St is a home located in Contra Costa County with nearby schools including Madera Elementary School, Fred T. Korematsu Middle School, and El Cerrito Senior High School.
Ownership History
Date
Name
Owned For
Owner Type
Purchase Details
Closed on
Aug 31, 2020
Sold by
Hirota Jamie Sue
Bought by
Hirota Jamie Sue T
Current Estimated Value
Home Financials for this Owner
Home Financials are based on the most recent Mortgage that was taken out on this home.
Original Mortgage
$215,374
Outstanding Balance
$154,031
Interest Rate
3%
Mortgage Type
New Conventional
Estimated Equity
$515,877
Purchase Details
Closed on
Oct 29, 2010
Sold by
Young Mary J
Bought by
Hirota Jamie Sue
Home Financials for this Owner
Home Financials are based on the most recent Mortgage that was taken out on this home.
Original Mortgage
$281,187
Interest Rate
4.33%
Mortgage Type
FHA
Purchase Details
Closed on
Sep 30, 1997
Sold by
Young Frank F and Young Mary J
Bought by
Young Frank F and Young Mary J
Create a Home Valuation Report for This Property
The Home Valuation Report is an in-depth analysis detailing your home's value as well as a comparison with similar homes in the area
Home Values in the Area
Average Home Value in this Area
Purchase History
| Date | Buyer | Sale Price | Title Company |
|---|---|---|---|
| Hirota Jamie Sue T | -- | Ticor Title | |
| Hirota Jamie Sue | $325,000 | Old Republic Title Company | |
| Young Frank F | -- | -- | |
| Young Frank F | -- | -- |
Source: Public Records
Mortgage History
| Date | Status | Borrower | Loan Amount |
|---|---|---|---|
| Open | Hirota Jamie Sue T | $215,374 | |
| Closed | Hirota Jamie Sue | $281,187 |
Source: Public Records
Tax History Compared to Growth
Tax History
| Year | Tax Paid | Tax Assessment Tax Assessment Total Assessment is a certain percentage of the fair market value that is determined by local assessors to be the total taxable value of land and additions on the property. | Land | Improvement |
|---|---|---|---|---|
| 2025 | $6,283 | $416,369 | $271,474 | $144,895 |
| 2024 | $6,173 | $408,205 | $266,151 | $142,054 |
| 2023 | $6,173 | $400,202 | $260,933 | $139,269 |
| 2022 | $6,063 | $392,356 | $255,817 | $136,539 |
| 2021 | $6,019 | $384,663 | $250,801 | $133,862 |
| 2019 | $5,638 | $373,256 | $243,363 | $129,893 |
| 2018 | $5,440 | $365,939 | $238,592 | $127,347 |
| 2017 | $5,357 | $358,764 | $233,914 | $124,850 |
| 2016 | $5,333 | $351,730 | $229,328 | $122,402 |
| 2015 | $5,350 | $346,448 | $225,884 | $120,564 |
| 2014 | $4,577 | $285,000 | $185,820 | $99,180 |
Source: Public Records
Map
Nearby Homes
- 1130 Richmond St
- 1213 Richmond St
- 1225 Richmond St
- 1225 Elm St
- 1244 Liberty St
- 1029 Ranchito Ct
- 1330 Elm St
- 1034 Navellier St
- 951 Lexington Ave
- 6727 Waldo Ave
- 7788 Moeser Ln
- 10496 San Pablo Ave
- 10280 San Pablo Ave
- 5955 Wenk Ave
- 876 Balra Dr
- 7553 Stockton Ave
- 7347 Terrace Dr
- 7318 Gladys Ave
- 6124 Santa Cruz Ave
- 1623 Butte St
- 1160 Richmond St
- 1164 Richmond St
- 1158 Richmond St
- 1156 Richmond St Unit 1156
- 1156 Richmond St
- 1166 Richmond St
- 1168 Richmond St
- 1150 Richmond St
- 1154 Richmond St
- 1170 Richmond St
- 1123 Norvell Ct
- 1152 Richmond St
- 1121 Norvell Ct
- 1148 Richmond St
- 1172 Richmond St
- 1146 Richmond St
- 1174 Richmond St
- 1144 Richmond St
- 1125 Norvell Ct
- 1142 Richmond St