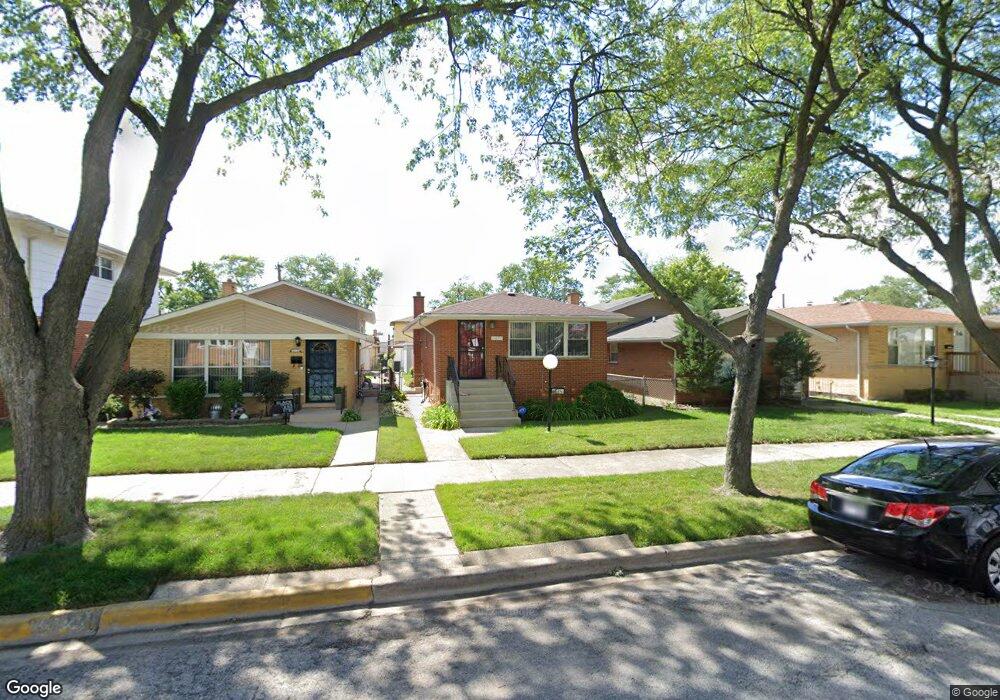
11624 S Laflin St Chicago, IL 60643
West Pullman NeighborhoodEstimated Value: $154,000 - $205,000
3
Beds
1
Bath
900
Sq Ft
$198/Sq Ft
Est. Value
About This Home
This home is located at 11624 S Laflin St, Chicago, IL 60643 and is currently estimated at $178,050, approximately $197 per square foot. 11624 S Laflin St is a home located in Cook County with nearby schools including Whistler Elementary School and Fenger Academy High School.
Ownership History
Date
Name
Owned For
Owner Type
Purchase Details
Closed on
Dec 9, 1997
Sold by
The Morrison Group Inc
Bought by
Clark Versie R and Clark Yvonne J
Current Estimated Value
Home Financials for this Owner
Home Financials are based on the most recent Mortgage that was taken out on this home.
Original Mortgage
$79,050
Outstanding Balance
$13,480
Interest Rate
7.32%
Mortgage Type
VA
Estimated Equity
$164,570
Purchase Details
Closed on
Dec 8, 1997
Sold by
Morrison James E and Morrison Susan B
Bought by
The Morrison Group Inc
Home Financials for this Owner
Home Financials are based on the most recent Mortgage that was taken out on this home.
Original Mortgage
$79,050
Outstanding Balance
$13,480
Interest Rate
7.32%
Mortgage Type
VA
Estimated Equity
$164,570
Purchase Details
Closed on
Jul 11, 1997
Sold by
Chicago Urban League Development Corp
Bought by
Morrison James E and Morrison Susan B
Home Financials for this Owner
Home Financials are based on the most recent Mortgage that was taken out on this home.
Original Mortgage
$51,000
Interest Rate
7.65%
Purchase Details
Closed on
Jun 30, 1997
Sold by
Hud
Bought by
Chicago Urban League Development Corp
Home Financials for this Owner
Home Financials are based on the most recent Mortgage that was taken out on this home.
Original Mortgage
$51,000
Interest Rate
7.65%
Create a Home Valuation Report for This Property
The Home Valuation Report is an in-depth analysis detailing your home's value as well as a comparison with similar homes in the area
Home Values in the Area
Average Home Value in this Area
Purchase History
| Date | Buyer | Sale Price | Title Company |
|---|---|---|---|
| Clark Versie R | $77,500 | -- | |
| The Morrison Group Inc | -- | -- | |
| Morrison James E | $26,000 | -- | |
| Chicago Urban League Development Corp | -- | -- |
Source: Public Records
Mortgage History
| Date | Status | Borrower | Loan Amount |
|---|---|---|---|
| Open | Clark Versie R | $79,050 | |
| Previous Owner | Morrison James E | $51,000 |
Source: Public Records
Tax History Compared to Growth
Tax History
| Year | Tax Paid | Tax Assessment Tax Assessment Total Assessment is a certain percentage of the fair market value that is determined by local assessors to be the total taxable value of land and additions on the property. | Land | Improvement |
|---|---|---|---|---|
| 2024 | $1,064 | $12,000 | $2,250 | $9,750 |
| 2023 | $999 | $11,000 | $1,875 | $9,125 |
| 2022 | $999 | $11,000 | $1,875 | $9,125 |
| 2021 | $1,547 | $11,000 | $1,875 | $9,125 |
| 2020 | $741 | $6,422 | $2,437 | $3,985 |
| 2019 | $747 | $7,136 | $2,437 | $4,699 |
| 2018 | $733 | $7,136 | $2,437 | $4,699 |
| 2017 | $1,412 | $9,919 | $2,250 | $7,669 |
| 2016 | $1,490 | $9,919 | $2,250 | $7,669 |
| 2015 | $1,340 | $9,919 | $2,250 | $7,669 |
| 2014 | $1,054 | $8,236 | $2,062 | $6,174 |
| 2013 | $1,022 | $8,236 | $2,062 | $6,174 |
Source: Public Records
Map
Nearby Homes
- 11625 S Laflin St
- 11724 S Laflin St
- 11741 S Laflin St
- 11724 S Loomis St
- 11740 S Loomis St
- 11635 S Ada St
- 1450 W 114th Place
- 11832 S Bishop St
- 11531 S Throop St
- 11604 S Elizabeth St
- 11616 S Racine Ave
- 11530 S Racine Ave
- 11637 S Racine Ave
- 11345 S Ada St
- 11657 S Racine Ave
- 11425 S Elizabeth St
- 11437 S Watkins Ave
- 1721 W Steuben St
- 1745 W Steuben St
- 11501 S Vincennes Ave
- 11620 S Laflin St
- 11628 S Laflin St
- 11618 S Laflin St
- 11634 S Laflin St
- 11612 S Laflin St
- 11636 S Laflin St
- 11625 S Justine St
- 11629 S Justine St
- 11623 S Justine St
- 11610 S Laflin St
- 11640 S Laflin St
- 11631 S Justine St
- 11619 S Justine St
- 11635 S Justine St
- 11617 S Justine St
- 11642 S Laflin St
- 11637 S Justine St
- 11613 S Justine St
- 11629 S Laflin St