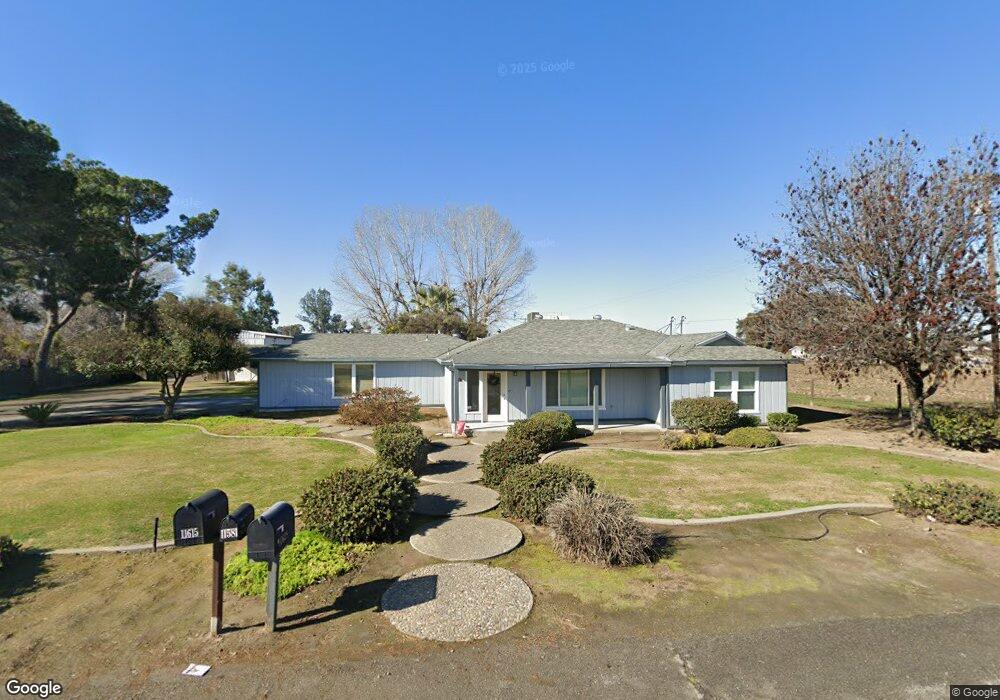
11628 17th Ave Lemoore, CA 93245
Estimated Value: $484,000 - $655,000
3
Beds
2
Baths
2,364
Sq Ft
$225/Sq Ft
Est. Value
About This Home
This home is located at 11628 17th Ave, Lemoore, CA 93245 and is currently estimated at $531,693, approximately $224 per square foot. 11628 17th Ave is a home located in Kings County with nearby schools including Lemoore Elementary School, Liberty Middle School, and Lemoore High School.
Ownership History
Date
Name
Owned For
Owner Type
Purchase Details
Closed on
Feb 9, 2021
Sold by
Jacobs Robert E and Jacobs Revocable Livi Robert E
Bought by
Jacobs Richard E and Robert E Jacobs Irrevocable Tr
Current Estimated Value
Purchase Details
Closed on
Nov 26, 2016
Sold by
Howell Joseph Dwight
Bought by
Melo Howell Jr Joseph Dwight and Melo Lewis Julie Dawn
Purchase Details
Closed on
Dec 9, 2010
Sold by
Jacobs Robert Earl and Jacobs Robert E
Bought by
Jacobs Robert E and The Robert E Jacobs Revocable Living Tru
Purchase Details
Closed on
Jun 30, 2009
Sold by
Bank Of New York
Bought by
Jacobs Robert E
Purchase Details
Closed on
Jan 5, 2009
Sold by
Bonilla Patty Kathy and Patty Dean Patrick
Bought by
Bank Of New York
Purchase Details
Closed on
Jul 27, 2001
Sold by
Laurent Diane J
Bought by
Patty Dean Patrick and Bonilla Patty Kathy
Home Financials for this Owner
Home Financials are based on the most recent Mortgage that was taken out on this home.
Original Mortgage
$175,500
Interest Rate
7.09%
Purchase Details
Closed on
May 24, 2000
Sold by
Laurent James R
Bought by
Laurent Diane J
Create a Home Valuation Report for This Property
The Home Valuation Report is an in-depth analysis detailing your home's value as well as a comparison with similar homes in the area
Home Values in the Area
Average Home Value in this Area
Purchase History
| Date | Buyer | Sale Price | Title Company |
|---|---|---|---|
| Jacobs Richard E | -- | None Available | |
| Melo Howell Jr Joseph Dwight | -- | None Available | |
| Jacobs Robert E | -- | None Available | |
| Jacobs Robert E | $230,000 | First American Title Company | |
| Bank Of New York | $175,500 | First American Title Ins Co | |
| Patty Dean Patrick | $195,000 | Chicago Title Co | |
| Laurent Diane J | -- | -- |
Source: Public Records
Mortgage History
| Date | Status | Borrower | Loan Amount |
|---|---|---|---|
| Previous Owner | Patty Dean Patrick | $175,500 |
Source: Public Records
Tax History
| Year | Tax Paid | Tax Assessment Tax Assessment Total Assessment is a certain percentage of the fair market value that is determined by local assessors to be the total taxable value of land and additions on the property. | Land | Improvement |
|---|---|---|---|---|
| 2025 | $3,038 | $305,678 | $103,264 | $202,414 |
| 2023 | $3,038 | $293,810 | $99,255 | $194,555 |
| 2022 | $3,185 | $288,050 | $97,309 | $190,741 |
| 2021 | $3,103 | $282,402 | $95,401 | $187,001 |
| 2020 | $3,085 | $279,507 | $94,423 | $185,084 |
| 2019 | $3,061 | $274,027 | $92,572 | $181,455 |
| 2018 | $2,875 | $268,654 | $90,757 | $177,897 |
| 2017 | $2,870 | $263,386 | $88,977 | $174,409 |
| 2016 | $2,698 | $258,221 | $87,232 | $170,989 |
| 2015 | $2,686 | $254,343 | $85,922 | $168,421 |
| 2014 | $2,606 | $249,361 | $84,239 | $165,122 |
Source: Public Records
Map
Nearby Homes
- 1059 Geneva Dr
- 863 Legacy Dr
- 0 E D St E
- 0 E Bush and East D St
- 0 E Bush and E D St
- 692 Firenze St
- 903 Boxwood Ln
- 763 Balboa Ave
- 834 E D St
- 824 E D St
- 836 E D St
- 852 Azalea Ln
- 609 Oleander Ave
- 0 Oleander Ave
- 0 E Bush St Unit 233046
- 0 E Bush St
- 237 Smith Ave
- 374 E Bush St
- 1133 Cousins Ct
- 351 Barcelona Dr
Your Personal Tour Guide
Ask me questions while you tour the home.