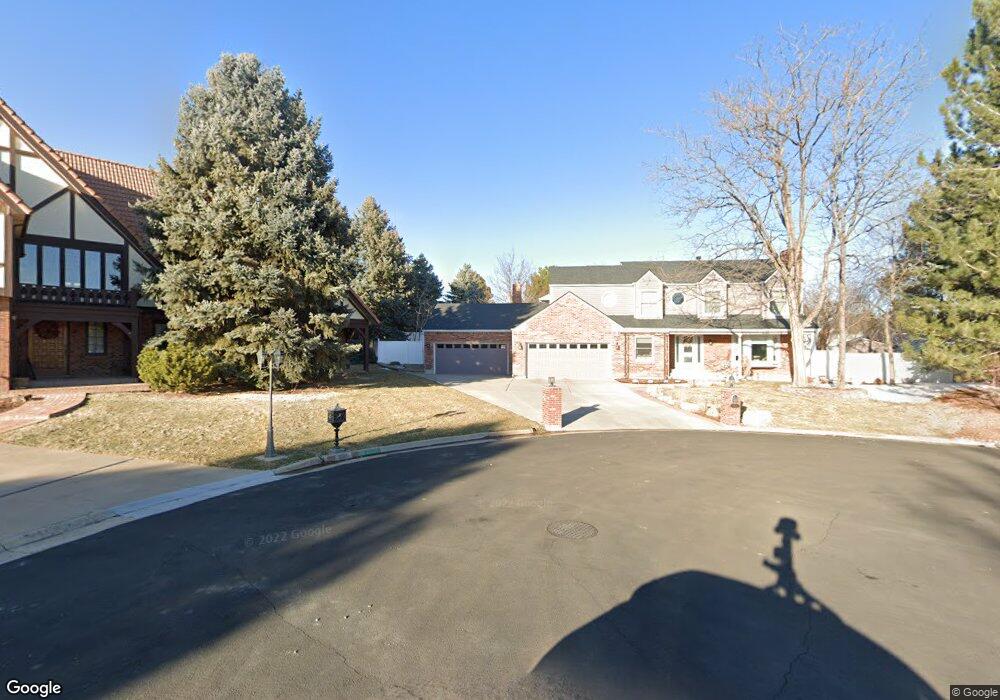
11628 Quivas Cir Denver, CO 80234
The Ranch NeighborhoodEstimated Value: $946,000 - $1,077,000
5
Beds
4
Baths
4,006
Sq Ft
$250/Sq Ft
Est. Value
About This Home
This home is located at 11628 Quivas Cir, Denver, CO 80234 and is currently estimated at $1,001,038, approximately $249 per square foot. 11628 Quivas Cir is a home located in Adams County with nearby schools including Cotton Creek Elementary School, Silver Hills Middle School, and Mountain Range High School.
Ownership History
Date
Name
Owned For
Owner Type
Purchase Details
Closed on
Sep 27, 2019
Sold by
Booth Richard L and Booth Jennifer A
Bought by
Scott Shelby and Terrill Troy
Current Estimated Value
Home Financials for this Owner
Home Financials are based on the most recent Mortgage that was taken out on this home.
Original Mortgage
$484,350
Outstanding Balance
$425,180
Interest Rate
3.6%
Mortgage Type
New Conventional
Estimated Equity
$575,859
Purchase Details
Closed on
Jul 31, 1998
Sold by
Wendt Clarence J and Wendt Caroline K
Bought by
Booth Richard L and Booth Jennifer A
Home Financials for this Owner
Home Financials are based on the most recent Mortgage that was taken out on this home.
Original Mortgage
$184,000
Interest Rate
6.95%
Mortgage Type
Stand Alone First
Purchase Details
Closed on
Dec 30, 1996
Sold by
Wendt Michael
Bought by
Wendt Clarence J and Wendt Caroline K
Purchase Details
Closed on
Dec 1, 1996
Sold by
Wendt Patrick
Bought by
Wendt Clarence J and Wendt Caroline K
Create a Home Valuation Report for This Property
The Home Valuation Report is an in-depth analysis detailing your home's value as well as a comparison with similar homes in the area
Home Values in the Area
Average Home Value in this Area
Purchase History
| Date | Buyer | Sale Price | Title Company |
|---|---|---|---|
| Scott Shelby | $640,000 | Empire Title Co Springs Llc | |
| Booth Richard L | $230,000 | North American Title Co | |
| Wendt Clarence J | $7,577 | -- | |
| Wendt Clarence J | $7,577 | -- | |
| Wendt Clarence J | $3,898 | -- |
Source: Public Records
Mortgage History
| Date | Status | Borrower | Loan Amount |
|---|---|---|---|
| Open | Scott Shelby | $484,350 | |
| Previous Owner | Booth Richard L | $184,000 |
Source: Public Records
Tax History Compared to Growth
Tax History
| Year | Tax Paid | Tax Assessment Tax Assessment Total Assessment is a certain percentage of the fair market value that is determined by local assessors to be the total taxable value of land and additions on the property. | Land | Improvement |
|---|---|---|---|---|
| 2024 | $6,447 | $62,500 | $9,810 | $52,690 |
| 2023 | $6,378 | $69,200 | $10,620 | $58,580 |
| 2022 | $5,167 | $49,160 | $10,910 | $38,250 |
| 2021 | $5,337 | $49,160 | $10,910 | $38,250 |
| 2020 | $4,757 | $44,690 | $11,230 | $33,460 |
| 2019 | $4,766 | $44,690 | $11,230 | $33,460 |
| 2018 | $4,599 | $41,710 | $9,940 | $31,770 |
| 2017 | $4,149 | $41,710 | $9,940 | $31,770 |
| 2016 | $3,972 | $38,710 | $7,560 | $31,150 |
| 2015 | $3,967 | $38,710 | $7,560 | $31,150 |
| 2014 | -- | $36,060 | $6,850 | $29,210 |
Source: Public Records
Map
Nearby Homes
- 11485 Pecos St
- Apex (on Crawl) Plan at Knolls at Westminster - Knolls in Westminster
- Vista (on Crawl) Plan at Knolls at Westminster - Knolls in Westminster
- Zenith Plan at Knolls at Westminster - Knolls in Westminster
- Equinox Plan at Knolls at Westminster - Knolls in Westminster
- Summit (on Crawl) Plan at Knolls at Westminster - Knolls in Westminster
- Zenith (on crawl) Plan at Knolls at Westminster - Knolls in Westminster
- Triumph Plan at Knolls at Westminster - Knolls in Westminster
- Capstone Plan at Knolls at Westminster - Knolls in Westminster
- Apex Plan at Knolls at Westminster - Knolls in Westminster
- Solstice Plan at Knolls at Westminster - Knolls in Westminster
- Vista Plan at Knolls at Westminster - Knolls in Westminster
- 2363 W 118th Ave
- 11351 Quivas Way
- 4855 N Zuni St
- 1665 W 113th Ave
- 11210 Quivas Loop
- 2421 Ranch Reserve Ridge
- 13507 Huron St
- 12132 Huron St Unit 203
- 11626 Quivas Cir
- 11621 Quivas Cir
- 11623 Quivas Cir
- 11624 Quivas Cir
- 11627 Quivas Cir
- 11632 Quivas Way
- 11634 Quivas Way
- 11622 Quivas Cir
- 11622 Quivas Cir Unit 1
- 11629 Quivas Cir
- 11642 Quivas Way
- 11620 Quivas Cir
- 11644 Quivas Way
- 11614 Quivas Way
- 11643 Shoshone Way
- 11640 Shoshone Way
- 11638 Shoshone Way
- 11612 Quivas Way
- 11641 Shoshone Way
- 11610 Quivas Way