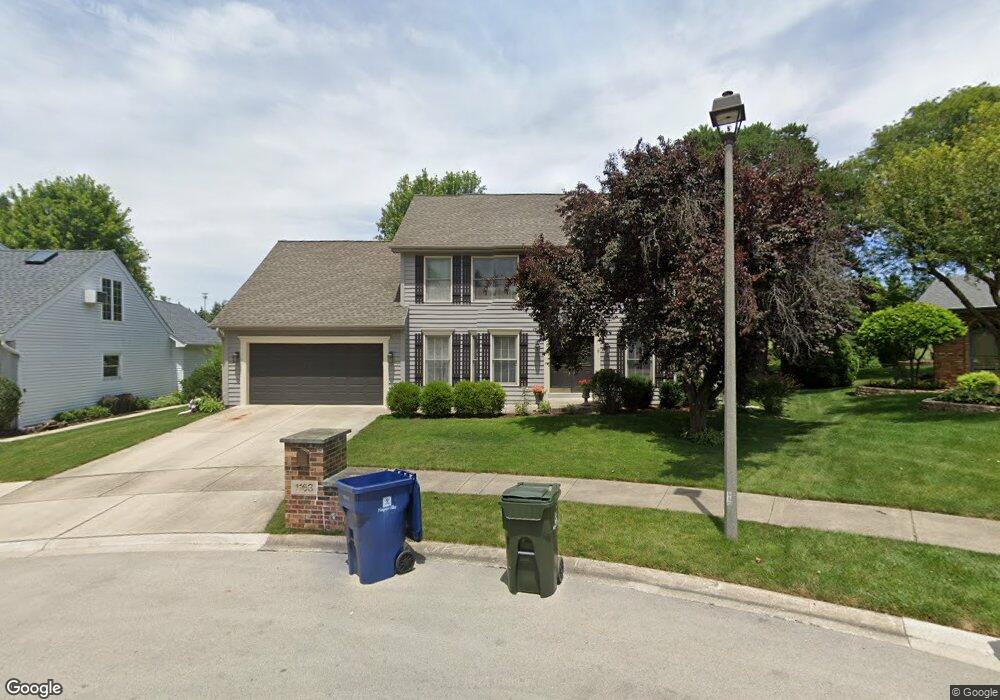
1163 Milburn Ct Naperville, IL 60540
East Naperville NeighborhoodEstimated Value: $629,007 - $825,000
4
Beds
3
Baths
2,597
Sq Ft
$286/Sq Ft
Est. Value
About This Home
This home is located at 1163 Milburn Ct, Naperville, IL 60540 and is currently estimated at $743,502, approximately $286 per square foot. 1163 Milburn Ct is a home located in DuPage County with nearby schools including Highlands Elementary School, Kennedy Junior High School, and Naperville North High School.
Ownership History
Date
Name
Owned For
Owner Type
Purchase Details
Closed on
Aug 25, 2003
Sold by
Burke Colleen M and Burke James J
Bought by
Hu Chiajen and Liu Wen Lii
Current Estimated Value
Home Financials for this Owner
Home Financials are based on the most recent Mortgage that was taken out on this home.
Original Mortgage
$210,000
Interest Rate
6.01%
Mortgage Type
Purchase Money Mortgage
Purchase Details
Closed on
Oct 21, 1997
Sold by
Burke James J and Burke Colleen M
Bought by
Burke Colleen M and Burke James J
Purchase Details
Closed on
Aug 24, 1995
Sold by
Canali Charles F
Bought by
Burke James J and Burke Colleen M
Home Financials for this Owner
Home Financials are based on the most recent Mortgage that was taken out on this home.
Original Mortgage
$176,400
Interest Rate
6.25%
Create a Home Valuation Report for This Property
The Home Valuation Report is an in-depth analysis detailing your home's value as well as a comparison with similar homes in the area
Home Values in the Area
Average Home Value in this Area
Purchase History
| Date | Buyer | Sale Price | Title Company |
|---|---|---|---|
| Hu Chiajen | $392,000 | Atgf Inc | |
| Burke Colleen M | -- | -- | |
| Burke James J | $220,500 | -- |
Source: Public Records
Mortgage History
| Date | Status | Borrower | Loan Amount |
|---|---|---|---|
| Previous Owner | Hu Chiajen | $210,000 | |
| Previous Owner | Burke James J | $176,400 |
Source: Public Records
Tax History
| Year | Tax Paid | Tax Assessment Tax Assessment Total Assessment is a certain percentage of the fair market value that is determined by local assessors to be the total taxable value of land and additions on the property. | Land | Improvement |
|---|---|---|---|---|
| 2024 | $10,808 | $184,418 | $70,958 | $113,460 |
| 2023 | $10,417 | $168,310 | $64,760 | $103,550 |
| 2022 | $10,200 | $163,600 | $62,950 | $100,650 |
| 2021 | $9,828 | $157,410 | $60,570 | $96,840 |
| 2020 | $9,619 | $154,580 | $59,480 | $95,100 |
| 2019 | $9,340 | $147,900 | $56,910 | $90,990 |
| 2018 | $8,732 | $138,620 | $53,340 | $85,280 |
| 2017 | $8,556 | $133,940 | $51,540 | $82,400 |
| 2016 | $8,385 | $129,100 | $49,680 | $79,420 |
| 2015 | $8,331 | $121,570 | $46,780 | $74,790 |
| 2014 | $7,780 | $110,520 | $42,530 | $67,990 |
| 2013 | $7,662 | $110,780 | $42,630 | $68,150 |
Source: Public Records
Map
Nearby Homes
- 1068 Mattande Ln
- 24 S Huffman St
- 915 E Chicago Ave
- 932 E Chicago Ave
- 5 N Columbia St
- 340 N Wright St
- 818 Fairwinds Ct
- 221 Olesen Dr
- 226 S Columbia St
- 203 S Columbia St
- 825 Biltmore Ct
- 25W313 Mayflower Ave
- 1314 Haverhill Cir
- 636 E 4th Ave
- 479 S Julian St
- 820 Prairie Ave
- 488 S Columbia St
- 328 S Loomis St
- 223 N Ellsworth St
- 837 N Loomis St
- 1159 Milburn Ct
- 1167 Milburn Ct
- 1158 Timberlane Ct
- 1154 Timberlane Ct
- 1155 Milburn Ct
- 1162 Timberlane Ct
- 1162 Milburn Ct
- 1150 Timberlane Ct
- 1158 Milburn Ct
- 1154 Milburn Ct
- 1150 Milburn Ct
- 1163 Peachtree Ct Unit 2
- 1163 Timberlane Ct
- 1159 Timberlane Ct
- 1038 Colonial Ct
- 1159 Peachtree Ct
- 1155 Timberlane Ct
- 1167 Peachtree Ct
- 1037 Colonial Ct
- 1155 Peachtree Ct Unit 2
Your Personal Tour Guide
Ask me questions while you tour the home.