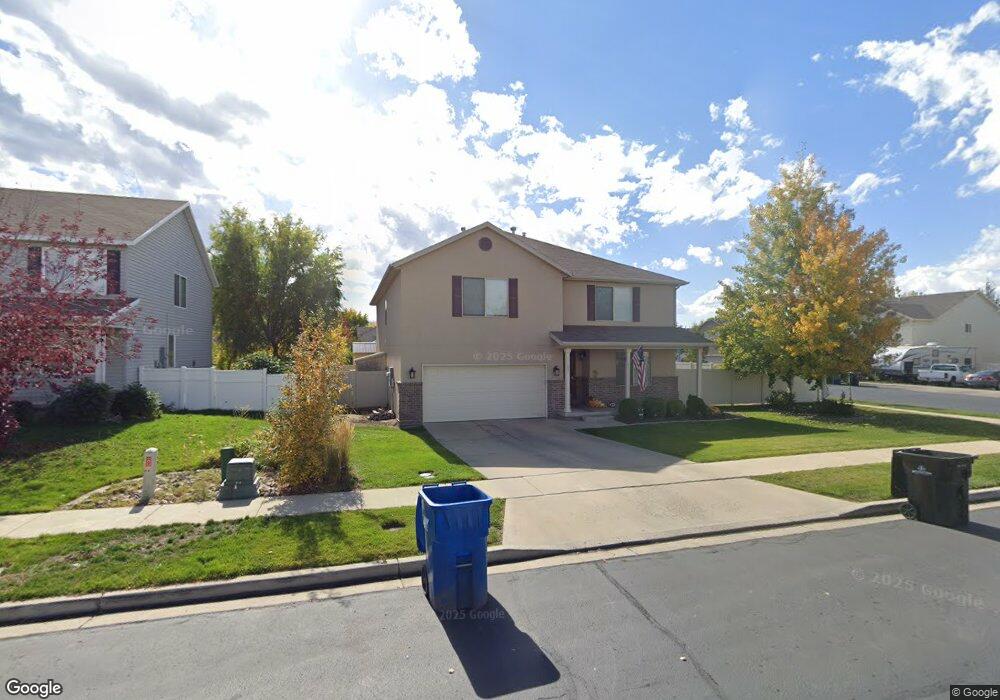
1163 W 400 S Spanish Fork, UT 84660
Estimated Value: $526,000 - $663,000
4
Beds
3
Baths
3,528
Sq Ft
$171/Sq Ft
Est. Value
About This Home
This home is located at 1163 W 400 S, Spanish Fork, UT 84660 and is currently estimated at $603,038, approximately $170 per square foot. 1163 W 400 S is a home located in Utah County with nearby schools including Riverview Elementary School, Spanish Fork Jr High School, and Spanish Fork High School.
Ownership History
Date
Name
Owned For
Owner Type
Purchase Details
Closed on
Jun 16, 2015
Sold by
Berbert Michael D and Berbert Brittaney L
Bought by
Wangsgard Tyler K and Wangsgard Cheryl A
Current Estimated Value
Home Financials for this Owner
Home Financials are based on the most recent Mortgage that was taken out on this home.
Original Mortgage
$256,500
Outstanding Balance
$198,808
Interest Rate
3.77%
Mortgage Type
New Conventional
Estimated Equity
$404,230
Purchase Details
Closed on
Jul 14, 2006
Sold by
Fieldstone Homes Utah Llc
Bought by
Berbert Michael D and Berbert Brittaney L
Home Financials for this Owner
Home Financials are based on the most recent Mortgage that was taken out on this home.
Original Mortgage
$47,500
Interest Rate
6.57%
Mortgage Type
Stand Alone Second
Create a Home Valuation Report for This Property
The Home Valuation Report is an in-depth analysis detailing your home's value as well as a comparison with similar homes in the area
Home Values in the Area
Average Home Value in this Area
Purchase History
| Date | Buyer | Sale Price | Title Company |
|---|---|---|---|
| Wangsgard Tyler K | -- | Inwest Title | |
| Berbert Michael D | -- | Bartlett Title Insurance Ag |
Source: Public Records
Mortgage History
| Date | Status | Borrower | Loan Amount |
|---|---|---|---|
| Open | Wangsgard Tyler K | $256,500 | |
| Previous Owner | Berbert Michael D | $47,500 | |
| Previous Owner | Berbert Michael D | $190,000 |
Source: Public Records
Tax History Compared to Growth
Tax History
| Year | Tax Paid | Tax Assessment Tax Assessment Total Assessment is a certain percentage of the fair market value that is determined by local assessors to be the total taxable value of land and additions on the property. | Land | Improvement |
|---|---|---|---|---|
| 2025 | $2,656 | $287,595 | $177,000 | $345,900 |
| 2024 | $2,656 | $273,790 | $0 | $0 |
| 2023 | $2,742 | $282,920 | $0 | $0 |
| 2022 | $2,621 | $265,210 | $0 | $0 |
| 2021 | $2,238 | $362,300 | $105,700 | $256,600 |
| 2020 | $2,134 | $335,900 | $96,100 | $239,800 |
| 2019 | $1,927 | $319,200 | $87,700 | $231,500 |
| 2018 | $1,869 | $299,200 | $80,700 | $218,500 |
| 2017 | $1,822 | $156,805 | $0 | $0 |
| 2016 | $1,574 | $133,650 | $0 | $0 |
| 2015 | $1,561 | $130,955 | $0 | $0 |
| 2014 | $1,382 | $116,380 | $0 | $0 |
Source: Public Records
Map
Nearby Homes
- 333 S 1170 W
- 429 S 1280 W
- 1026 W 350 S
- 1299 W 250 S
- 1377 W 450 S
- 501 S 880 W
- 1076 River Hill Dr
- 231 S 880 W
- 903 W 100 S
- 1256 W 800 S Unit 25
- 1256 W 800 S
- 1171 W 800 S Unit 38
- Aspen Plan at River Point
- Solitude Plan at River Point
- Snowbasin Plan at River Point
- Telluride Plan at River Point
- Breckenridge Plan at River Point
- Sundance Plan at River Point
- Vail Plan at River Point
- Brighton Plan at River Point