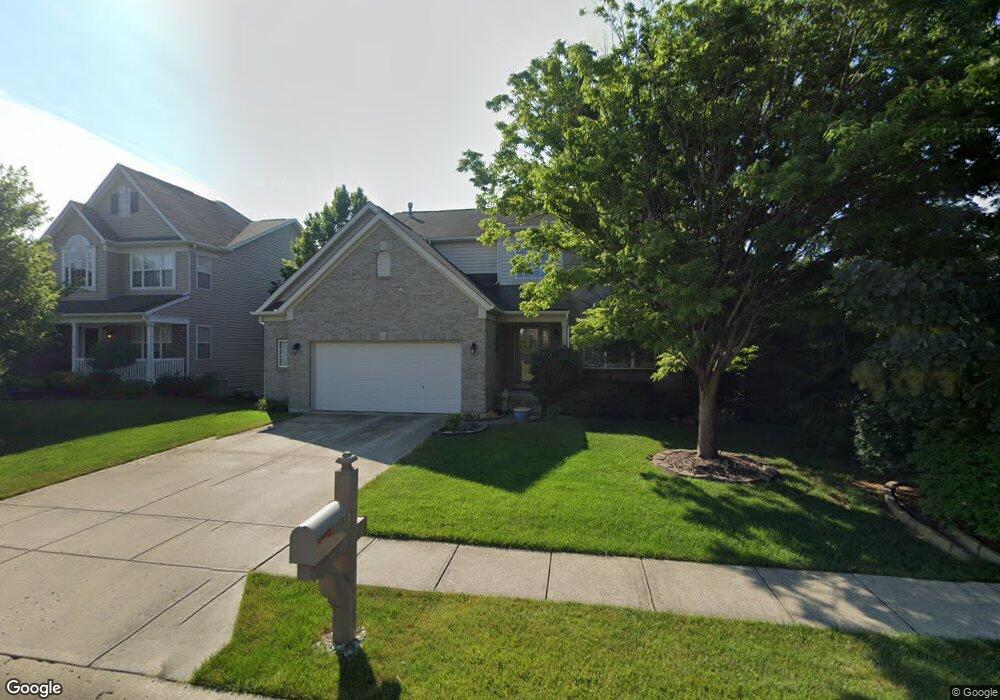
11631 Gatwick View Dr Fishers, IN 46037
Estimated Value: $425,000 - $444,000
4
Beds
3
Baths
3,592
Sq Ft
$121/Sq Ft
Est. Value
About This Home
This home is located at 11631 Gatwick View Dr, Fishers, IN 46037 and is currently estimated at $436,196, approximately $121 per square foot. 11631 Gatwick View Dr is a home located in Hamilton County with nearby schools including Fall Creek Elementary School, Fall Creek Intermediate School, and Hamilton Southeastern High School.
Ownership History
Date
Name
Owned For
Owner Type
Purchase Details
Closed on
Dec 11, 2017
Sold by
Mooneyham George W
Bought by
Mathews Carol J
Current Estimated Value
Purchase Details
Closed on
Feb 8, 2008
Sold by
Mathews Carol J
Bought by
Mathews Carol J and Mooneyham George W
Home Financials for this Owner
Home Financials are based on the most recent Mortgage that was taken out on this home.
Original Mortgage
$208,800
Interest Rate
5.9%
Mortgage Type
New Conventional
Purchase Details
Closed on
Oct 26, 2005
Sold by
Rh Of Indiana Lp
Bought by
Mathews Carol J
Home Financials for this Owner
Home Financials are based on the most recent Mortgage that was taken out on this home.
Original Mortgage
$152,100
Interest Rate
6.3%
Mortgage Type
Fannie Mae Freddie Mac
Create a Home Valuation Report for This Property
The Home Valuation Report is an in-depth analysis detailing your home's value as well as a comparison with similar homes in the area
Home Values in the Area
Average Home Value in this Area
Purchase History
| Date | Buyer | Sale Price | Title Company |
|---|---|---|---|
| Mathews Carol J | -- | None Available | |
| Mathews Carol J | -- | Towne & Country Land Title A | |
| Mathews Carol J | -- | -- |
Source: Public Records
Mortgage History
| Date | Status | Borrower | Loan Amount |
|---|---|---|---|
| Previous Owner | Mathews Carol J | $208,800 | |
| Previous Owner | Mathews Carol J | $152,100 |
Source: Public Records
Tax History Compared to Growth
Tax History
| Year | Tax Paid | Tax Assessment Tax Assessment Total Assessment is a certain percentage of the fair market value that is determined by local assessors to be the total taxable value of land and additions on the property. | Land | Improvement |
|---|---|---|---|---|
| 2024 | $4,469 | $397,600 | $49,500 | $348,100 |
| 2023 | $4,504 | $391,700 | $49,500 | $342,200 |
| 2022 | $4,120 | $344,300 | $49,500 | $294,800 |
| 2021 | $3,547 | $294,700 | $49,500 | $245,200 |
| 2020 | $3,334 | $276,400 | $49,500 | $226,900 |
| 2019 | $3,204 | $265,900 | $44,100 | $221,800 |
| 2018 | $2,999 | $248,700 | $44,100 | $204,600 |
| 2017 | $2,941 | $247,800 | $44,100 | $203,700 |
| 2016 | $2,814 | $238,400 | $44,100 | $194,300 |
| 2014 | $2,418 | $224,200 | $44,100 | $180,100 |
| 2013 | $2,418 | $226,200 | $44,100 | $182,100 |
Source: Public Records
Map
Nearby Homes
- 11791 Moate Dr
- 11353 Geist Bay Ct
- 12004 Gatwick View Dr
- 14598 Meadow Bend Dr
- 12039 Jesterwood Dr
- 14058 Southwood Cir
- 14402 Wolverton Way
- 11369 Easterly Blvd
- 14745 Autumn View Way
- 12318 Whispering Breeze Dr
- 11991 Shady Knoll Dr
- 14846 Starboard Rd
- 14682 Woodstone Cir
- 13665 E 114th St
- 14910 Garden Mist Place
- 11824 Sage Creek Bend
- 14332 Eddington Place
- 14982 Garden Mist Place
- 11833 Walker Ln
- Camden Plan at The Cove - Designer Collection
- 11641 Gatwick View Dr
- 10070 Gatwick View Dr
- 11638 Tylers Close
- 11661 Gatwick View Dr
- 11659 Langham Crescent Ct
- 11658 Tylers Close
- 11710 Gatwick View Dr
- 11618 Tylers Close
- 11678 Tylers Close
- 11709 Gatwick View Dr
- 11699 Langham Crescent Ct
- 11620 Langham Crescent Ct
- 11713 Langham Crescent Ct
- 11640 Langham Crescent Ct
- 11720 Gatwick View Dr
- 11609 Tylers Close
- 11727 Langham Crescent Ct
- 11660 Langham Crescent Ct
- 11680 Langham Crescent Ct
- 11659 Tylers Close